User: | Open Learning Faculty Member:

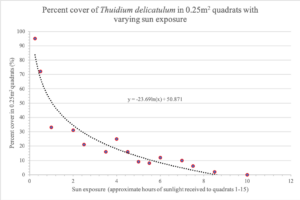
Above is the table I submitted for the fifth small assignment submission. It plots the relationship between the percent cover of Common Fern Moss, Thuidium delicatulum, and the degree of sun exposure in my yard. In order to create this graph, I had to measure the sunlight intensity of all quadrats (1-15) for every hour starting at 6:00 am and ending at 7:00pm on July 26th, 2019. Then, I sampled each individual quadrat for percent cover of T. delicatulum. I had some difficulty trying to categorize and separate each quadrat by the number of hours of sunlight received throughout this 13-hour time period. I eventually decided to basically approximate the relative amount of sun exposure received by each quadrat and used these values for the domain of this graph. When I put the graph together, I was very pleased to see that it follows my prediction (minus some outliers). I originally suspected that the graph of these two variables would be inversely proportional, and this graph mimics that trend. One of the outliers located at point (4,25) really stuck out to me because this quadrat happens to be located in a section of my yard in between the Japanese Lilac Tree and the Columnar Aspen. This area receives minimal sunlight and I recognized the soil in this area to be relatively moist when I was sampling in Module 2. Being that it is too difficult to go about sampling and representing soil moisture with the limited tools and resources I have at home, my best bet in inquiring about this specific observation would be scientific articles on this subject. I am curious to see if there are any scientific articles/studies out there that touch on the relationship between soil moisture and moss abundance. This would help for further exploration and answer a few questions I have going forward.
