User: | Open Learning Faculty Member:
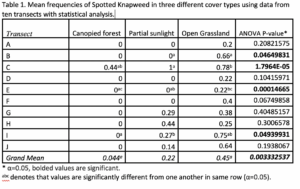
Organizing my data into my table was not difficult, only time consuming. Calculating mean values was quick and easy but conducting the statistical analysis was time consuming. I definitely had to do further research on the t-tests (and therefore also the necessary F-tests) for determining significance between means after the ANOVA test was completed. While this took time, it made sense in the end and I feel that I’ve presented all relevant statistics by doing so. The trend that I’ve noticed with the grand mean is that the canopied forest and the open grassland have significantly different frequencies of Spotted Knapweed. The partially lit open canopied forest is not significantly different from either of the other two cover types when looking at the grand mean; when looking at individual transects this may not be the case (see below). It would be interesting to see how these results would compare to a study with more samples to have an even better representation of the frequencies; additionally, it would be interesting to see data from studies of this nature at other sites.