User: | Open Learning Faculty Member:
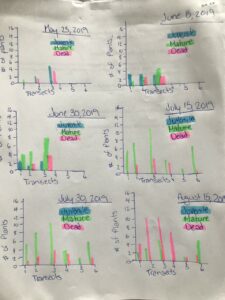
I had no issues organizing my data. I began by creating 6 tables (1 for each site visit) and have the total number of plants found in each Transect and if they were juvenile, mature, or dead plants. Once I had this information down in organized tables it was much easier to create bar graphs of our findings. I have attached 1 table and a graphical representation of all 6 site visits and their findings. I was surprised of my findings in transects 4-6 during site visits 1-3. This is because Heracleum mantegazzianum is a very strong plant and can handle all sorts of conditions, hense why it has been so successful as an invasive species in North America. But as this is the furthest North it has began to reach in British Columbia, the chances are it just has not made it to the denser forest and higher altitudes at this time.
| Transect | Juvenile | Mature | Dead |
| T1 | 0 | 1 | 0 |
| T2 | 3 | 0 | 2 |
| T3 | 6 | 0 | 4 |
| T4 | 0 | 0 | 0 |
| T5 | 0 | 0 | 0 |
| T6 | 0 | 0 | 0 |
| Total Mean | 1.5 | 0.2 | 1 |
(Table 1 – results of plants found on May 25th, 2019. Transect 1-3 are within Section 1 (disturbed sites) and Transects 4-6 are within Section 2 (natural site)).