User: | Open Learning Faculty Member:
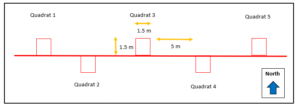
During my initial data collection, summarised in my Small Assignment 1 there were a few difficulties in implementing my sampling strategy. I was using 1.5 m by 1.5 m quadrats (2.25 m2) as my sampling unit along a transect, which in the field I measured out and delineated with tent pegs at each location (see Figure 1 below). I found this to be inefficient and time consuming. I also calculated the percentage slope by using tent pegs and measuring rise over run (over a 1 m distance), again I found myself measuring 1 m out at every quadrat, which again was time consuming.

Figure 1. Illustrating an east-west transect, with 1.5 m by 1.5 m quadrats (2.25 m2) spaced 5 m apart, alternating north and south of the transect.
The data was somewhat surprising, in all five replicates there was no common snowberry present which I didn’t expect. I also found the percentage slope I calculated at each quadrat was steeper in the Upland Area than I had visually assumed. I am curious to calculate the slope in my other areas (Transition Area and Riparian Area) to assess the difference in percentage slope between the three sites, they may be different to what I had expected from my visual assessment. I would also like the percentage slope between my three sites to be different from one another, to represent a flat, moderate and steep slope. Once I calculate the slope percentage in each three sites, the results may shift my prediction. I am currently predicting snowberry to be present on slopes less than 20% grade, which may change to slopes less than 30% grade, or on slopes less than 10% grade (depending on the results of my field sampling program).
I plan to modify my sampling technique in the field by improving my equipment. I plan to make a 1.5 m by 1.5 m PVC quadrat which will have markers every 0.5 m. Having the PVC quadrat will save time at each location and creating a marker every 0.5 m will improve efficiency when I am calculating slope at a 1 m horizontal distance.
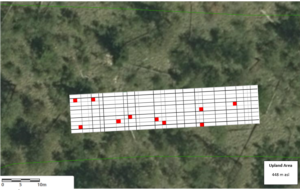
My sampling technique will also be modified by increasing my replicates to 10 quadrats per site as a minimum. I may also change my sampling technique from a transect to simple random as I want to increase the independence from one quadrat to the next. To do this, I will create a map showing each site represented by a 10 m by 50 m polygon: Riparian Area, Transition Area and Upland Area. Based on the polygon I will create an x and y axis and use a random number generator to locate the 10 quadrats within each site (see Figure 2 below for 10 quadrats within the Upland Area). I will use the map and the numbers generated to find the sampling locations in the field. This technique in the field may take more time to locate each quadrat, however this modified technique will increase my independence between quadrat as it’s a larger sample size (10 m by 50 m) compared to the transect method (3 m by 27.5 m) and this technique will help to prevent bias in the field.

Figure 2. Illustrating an alternative random sampling technique where 10 replicates are randomly located within a 10 m by 50 m polygon representing the Upland Area.
I will be improving the efficiency of my sampling protocol by using a standard 1.5 m by 1.5 m PVC quadrat, however I will potentially be increasing my time in the field because of the time required to locate each sample. I think my modifications will improve the independence, avoid bias and decrease the percentage error.
