User: | Open Learning Faculty Member:
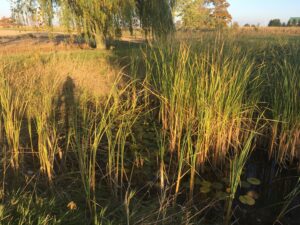
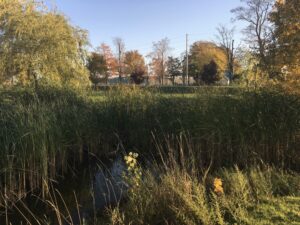
During my initial observations I determined the size of my entire study area (Figure 1 and 2). The size of is approximately 28m by 30m, which I then divided into four quadrants 14m by 15m. As discussed in my previous post after trial and error it was determined individually counting the species to research diversity and population density of invasive pond weeds would be best represented in a range. By utilizing a chart, I have visited the pond a handful of times, once a week and made note of the population densities for various plant species, based on their location surrounding the pond (N,E,W,S) and the ratio of interacting factors.
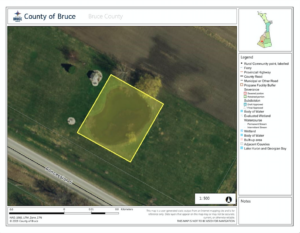
Figure 1: Study Area
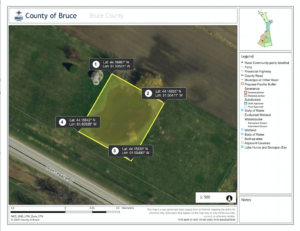
Figure 2: Study Area Coordinates
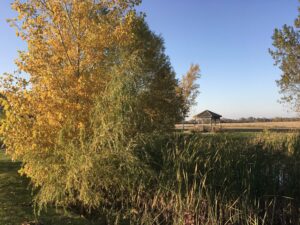
The following photos were taken October 20, 2019 at 5:00 pm on a sunny fall evening. The weather was approximately 10 degrees celsius and somewhat windy.