User: | Open Learning Faculty Member:
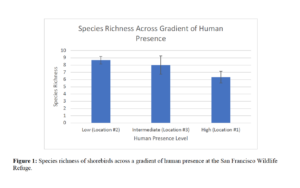
I created a graph to illustrate my species richness of shorebirds data, collected at the three different sampling locations at the San Francisco Bay Wildlife Refuge. These three different sampling locations correspond to 3 varying levels of human presence. Hence, this graph depicts shorebird species richness across a gradient of human presence at the wildlife refuge. I didn’t have any difficulties organizing, aggregating or summarizing this data. The outcome was what I expected in regard to the average species richness of shorebirds across the human presence gradient, however, the results between Location #1 and Location #2 are significant, so I would like to collect some more data to see if significance will be reached with a larger sample size.