User: | Open Learning Faculty Member:
The biological attribute that I want to study is soil, specifically soil texture along a slope gradient.
During my site visit to the grassland area I noticed that the site was distinctively broken into two zones: a steep slope section and a gentle slope section. The steep slopes are ≥ 25% while the gentler slopes are ≤ 18%. I decided to capture this transitional gradient by selecting 2 plots on the gentle slopes and two plots on the steep slopes to observe the soil textures in these two different slopes.
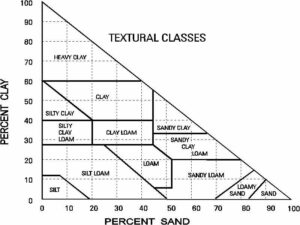
In texturing the four soil samples along the gradient I found that the two plots on the lower slope were both Silty Loam textures while the steep slope plots were both Sandy Loam textures. The higher percentage of sand in soil, the courser the soil.
Initial Hypothesis and Prediction: My hypothesis is that Slope % impacts soil texture results. My prediction is that the steeper the slope percent, the courser the soil texture results will be. Specifically, I predict that slopes ≥ 25% will have higher percent sand compared to slopes ≤ 18%.
Note: Vegetation type and vegetation cover can also impact soil texture, therefore I will be collecting data on both of these variables at each plot in subsequent data gathering.

Response Variable: Soil texture (Continuous)
Explanatory Variable: Slope % (Continuous), Vegetation type (Categorical), Vegetation Cover (Continuous).
References: Soil Triangle – https://governmentofbc.maps.arcgis.com/apps/MapJournal/index.html?appid=bfebc043b5a546deb9d381e36742407d