User: | Open Learning Faculty Member:
Setting up my study site and collecting my first set of data points was a fairly lengthy process and though it has turned out to be an exciting adventure, it has also been fraught with uncertainty and a bit of the mundane. Let me summarize:
Organism of study: Snow fleas (springtails) in northern BC.
Hypothesis: Snow flea density on the surface of the snow is correlated with the presence or absence of cover/shade.
Prediction: Snow fleas will increase in density when given the opportunity to seek cover or shade in an otherwise open-to-the-sky habitat.
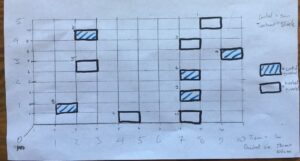
Study design: I created a manipulated simple random experiment in which I took a 50m2 plot of open ground in my lower garden (5m x 10m) and divided it into 100 cells that could be randomly chosen to select 10 0.5m x 1.0m quadrats for observation of snow fleas. 5 of the 10 cells would be randomly selected for treatment (with a shade-producing tent placed over top), while the other 5 cells would be my control group (open to the sky).
For independence, I stipulated that no two cells could be adjacent to each other – I did not want the shaded quadrats to affect the unshaded quadrats.
I divided each 0.5m x 1.0m quadrat further into 50 cells in order to randomly select 5 10cm x 10cm samples from which I would count the snow fleas.
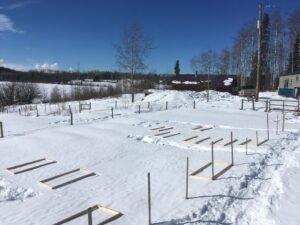
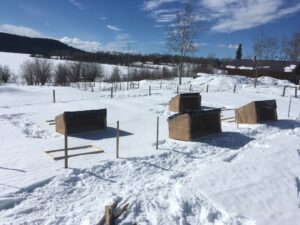
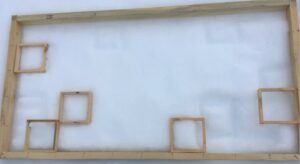
It took a few days of shop-work to create rectangle quadrats, tents and square sample units out of wood (this was the mundane part). When things were finally ready I set everything up outside and waited for the snow fleas to arrive. Figures 2 and 3 show how the site looked upon setup. Figure 4 is an example of one of the quadrats with 5 randomly spaced sample squares in it.
A few difficulties presented themselves:
- After I set up my 5 treatment and 5 control replicates, all I needed was to count snow fleas, right? But they were no where to be found! Some winter days they seem to speckle the snow in truly astronomical numbers, and other days they are completely absent. Following my preparation for studying these mysterious organisms, they followed the latter trend – completely absent. The reasons for this, I believe, was that for the three days following my setup (March 9-11) we had morning temperatures of < -10C and daytime temperatures at around 0C. Apparently, they don’t want to rise to the top of the snow if it is too cold.
- Cold but sunny days followed the setup of my wooden structures. The wooden quadrats and sample squares started to melt into the the snow, which I had carefully tried to not disturb in any way so as not to introduce confounding variables. The surface of the snow under the shaded coverings also seemed to be forming a different sort of crust than the surfaces left out in the open.
- Anxious to get some data collected, on March 11 I went and collected my first round of data, randomly selecting new spots for the sample square placements and counted a total of ONE flea out of 50 sample sites! And it was in one of the sunny quadrats, not the shade like I had predicted! Was it now too late in the year to see snow fleas on top of the snow? Was I going to have to come up with yet another study idea?
The next morning (March 12) I noticed on my way to work that the temperature had barely dropped below the freezing point. Throughout the morning at my place of work, I noticed snow fleas in large numbers hopping all over the snow. I was informed by certain helpers that my study site back at home was alive with snow fleas as well, though interestingly they seemed to be avoiding the shaded sites and were sticking to the sunnier areas. Returning home, I was able to randomly select new sample points and start counting by 15:00, and at last had a data set that I was able to draw some conclusions from – even though the density numbers were not as high as I had envisioned or would have liked. I counted more snow fleas in the control quadrats than in the treatment quadrats.
Was the data I gathered surprising in any way? Yes, frankly. During my initial observations, it seemed like snow fleas were present in higher numbers in the forest and under shade compared with open areas. In my study site, they were present in higher numbers in the control quadrats that had no coverings, and were almost not present at all under the tents that I had erected. Nevertheless, the fact that there was a noticeable difference between treatment and control encourages me to believe this study design might have some statistical significance, and I would probably choose to continue pursuing this approach to data gathering.
That being said, I am also interested in adding another layer to the snow flea study (though this may or may not occur depending on time and scope for the purpose of this course): modifying the snow depth at each quadrat site and eliminating the shade factor, so that the explanatory variable now becomes continuous in nature – snow depth in cm. The response variable would remain the same – density of snow fleas. This interests me because during those times when snow fleas are most abundant, they usually seem to congregate in places of distinct disturbance such as boot-prints. Because they are soil organisms and rise to the snow surface from the soil it would make sense that they exist all throughout the snow column and densities are probably greatest in lower snow-depths.