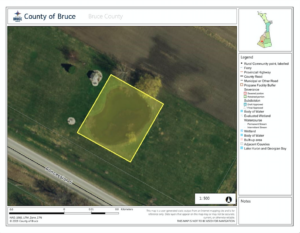
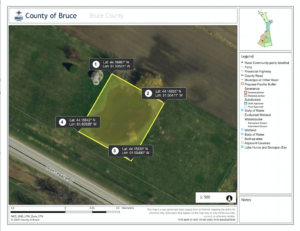
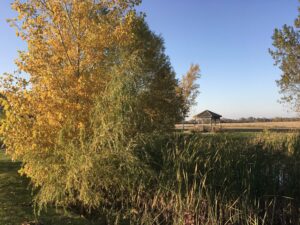
On November 10, 2019 between 10:45 AM and 4:00 PM I collected my field data at Kalamalka Lake Provincial Park along Cosens Bay Trail, Vernon BC. I sampled my three sites, Site 1 Eastern Area, Site 2 Riparian Area and Site 3 Upland Area. On the day of my field collection the temperature was approximately 12 degrees Celsius and throughout the day the weather varied from sunny, to some sun with cloudy conditions.
I sampled Site 1 Eastern Area first between 11:00 AM and 12.35 PM. I sampled Site 3 Upland Area second between 1:15 PM and 2:15 PM. I sampled Site 2 Riparian Area third between 2:25 PM and 3:20 PM. At each site I sampled 10 quadrats, my quadrat was 1.5 m by 1.5 m that I built using PVC pipe and PVC elbows. The area of each quadrat represents 2.25 m2. I sampled a total of 30 quadrats. Within each quadrat I recorded the time, weather conditions, number of stems of snowberry, snowberry cover class (1-6), upland slope (%), slope aspect, soil moisture, light, pH and recorded the other vegetation observed within each quadrat. The number of stems of snowberry within each quadrat will be processed to represent the density of snowberry. The cover class of snowberry represents the percentage cover of snowberry within each quadrat. I used a clinometer for the upland slope (%), a compass to record the slope aspect and a soil moisture meter to record the soil moisture, light and pH within each quadrat.
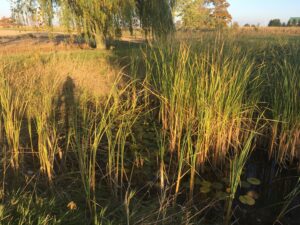
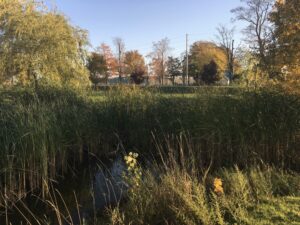
During my field collection, I had to adjust the area I sampled at Site 2 Riparian Area due to the dense vegetation and presence of poison ivy. The riparian area was long enough that I was able to move my sampling location south and still had enough space to implement my sampling design. Before I went into the field, I printed off field collection sheets, field maps and grid coordinates to make it more efficient to locate each quadrat in the field which I found very helpful. I timed my field collection when it was not raining, and before the first snowfall. One issue I found during my field collection was that most of the snowberry had lost it’s leaves and berries, so I had to spend more time at each quadrat identifying the snowberry stems. Ideally, I would have collected my field data before the leaves had fallen to make identification more efficient.
On review of my data collection, I found that snowberry was more abundant in Site 1 Eastern Area, where I expected snowberry to be more abundant in Site 2 Riparian Area. I also found the soil moisture in Site 1 Eastern Area was lower than Site 3 Upland Area where there was no snowberry observed. This observation was not what I predicted, I predicted that dry soils would not support snowberry distribution. My hypothesis, that snowberry distribution is determined by slope gradient percentage is supported by my field collection. I predicted that snowberry will be present in areas where slope is less than 20%. My field collection supports this, however the slope gradient percentage that I recorded ranged from 3% to 19% and then 35% to 47% where snowberry was present between 3% to 19% and not present between 35% to 47%. Ideally one of my sites would have a slope gradient percentage somewhere between 19% and 35% which would support or falsify my hypothesis.
I also observed that the soil depth in Site 1 Eastern Area and Site 2 Riparian Area was deeper than the soil in Site 2 Upland Area. I observed this when I inserted the soil moisture meter within each quadrat. I had not included soil depth as a variable that may contribute to snowberry distribution, therefore I will be considering this as a variable moving forward.
I may consider adding additional sites along Cosens Bay Trail to strengthen my data set.