Blog Post 5: Design Reflections

Initial data was collected at Mission Creek Regional Park on March 21, 2021. Systematic plots (400m^2) were used spanning from the mission creek riparian bank to the uplands crest, 100m total distance with plots alternating 20m along the transect. The number of pine and total number of trees were counted in each plot, with pine diameters measured and the average recorded.

Several difficulties were noted when implementing the sampling strategy. The first being physical constraints due to the terrain and floor vegetation, the transect was difficult to pace and plots challenging to confine. Another difficulty arose with plot size; counting and measuring individual trees became tedious. The collected data was surprising, with the number of Ponderosa pine remaining consistent along the transect though a gradient was suspected.

Moving forward I plan to collect data using plots of a smaller area to ease sampling constraints and modifying my approach to include adjacent area(s) of similar site characteristics to the study. I think this modification will improve research by increasing the data pool and providing a method of comparison.

Post #5 Design Reflections

Setting up my study site and collecting my first set of data points was a fairly lengthy process and though it has turned out to be an exciting adventure, it has also been fraught with uncertainty and a bit of the mundane. Let me summarize:

Organism of study: Snow fleas (springtails) in northern BC.

Hypothesis: Snow flea density on the surface of the snow is correlated with the presence or absence of cover/shade.

Prediction: Snow fleas will increase in density when given the opportunity to seek cover or shade in an otherwise open-to-the-sky habitat.

Figure 1. Simple Random study design. x and y coordinates generated at Random.org

Study design: I created a manipulated simple random experiment in which I took a 50m2 plot of open ground in my lower garden (5m x 10m) and divided it into 100 cells that could be randomly chosen to select 10 0.5m x 1.0m quadrats for observation of snow fleas. 5 of the 10 cells would be randomly selected for treatment (with a shade-producing tent placed over top), while the other 5 cells would be my control group (open to the sky).

For independence, I stipulated that no two cells could be adjacent to each other – I did not want the shaded quadrats to affect the unshaded quadrats.


I divided each 0.5m x 1.0m quadrat further into 50 cells in order to randomly select 5 10cm x 10cm samples from which I would count the snow fleas.

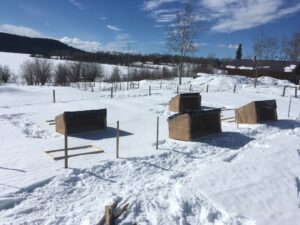
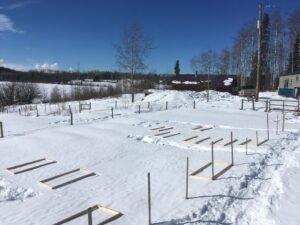
It took a few days of shop-work to create  rectangle quadrats, tents and square sample units out of wood (this was the mundane part). When things were finally ready I set everything up outside and waited for the snow fleas to arrive. Figures 2 and 3 show how the site looked upon setup. Figure 4 is an example of one of the quadrats with 5 randomly spaced sample squares in it.

Figure 2. Quadrats in the snow.
Figure 3. Covered and uncovered quadrats.
Figure 4: One replicate with 5 sample units.

A few difficulties presented themselves:

  1. After I set up my 5 treatment and 5 control replicates, all I needed was to count snow fleas, right? But they were no where to be found! Some winter days they seem to speckle the snow in truly astronomical numbers, and other days they are completely absent. Following my preparation for studying these mysterious organisms, they followed the latter trend – completely absent. The reasons for this, I believe, was that for the three days following my setup (March 9-11) we had morning temperatures of < -10C and daytime temperatures at around 0C. Apparently, they don’t want to rise to the top of the snow if it is too cold.
  2. Cold but sunny days followed the setup of my wooden structures. The wooden quadrats and sample squares started to melt into the the snow, which I had carefully tried to not disturb in any way so as not to introduce confounding variables. The surface of the snow under the shaded coverings also seemed to be forming a different sort of crust than the surfaces left out in the open.
  3. Anxious to get some data collected, on March 11 I went and collected my first round of data, randomly selecting new spots for the sample square placements and counted a total of ONE flea out of 50 sample sites! And it was in one of the sunny quadrats, not the shade like I had predicted! Was it now too late in the year to see snow fleas on top of the snow? Was I going to have to come up with yet another study idea?

The next morning (March 12) I noticed on my way to work that the temperature had barely dropped below the freezing point. Throughout the morning at my place of work, I noticed snow fleas in large numbers hopping all over the snow. I was informed by certain helpers that my study site back at home was alive with snow fleas as well, though interestingly they seemed to be avoiding the shaded sites and were sticking to the sunnier areas. Returning home, I was able to randomly select new sample points and start counting by 15:00, and at last had a data set that I was able to draw some conclusions from – even though the density numbers were not as high as I had envisioned or would have liked. I counted more snow fleas in the control quadrats than in the treatment quadrats.

Was the data I gathered surprising in any way? Yes, frankly. During my initial observations, it seemed like snow fleas were present in higher numbers in the forest and under shade compared with open areas. In my study site, they were present in higher numbers in the control quadrats that had no coverings, and were almost not present at all under the tents that I had erected. Nevertheless, the fact that there was a noticeable difference between treatment and control encourages me to believe this study design might have some statistical significance, and I would probably choose to continue pursuing this approach to data gathering.

That being said, I am also interested in adding another layer to the snow flea study (though this may or may not occur depending on time and scope for the purpose of this course): modifying the snow depth at each quadrat site and eliminating the shade factor, so that the explanatory variable now becomes continuous in nature – snow depth in cm. The response variable would remain the same – density of snow fleas. This interests me because during those times when snow fleas are most abundant, they usually seem to congregate in places of distinct disturbance such as boot-prints. Because they are soil organisms and rise to the snow surface from the soil it would make sense that they exist all throughout the snow column and densities are probably greatest in lower snow-depths.


Blog Post 5: Design Reflections

The main difficulty with my sampling strategy was to do with the site locations. Before I began sampling, I went out to the field and used coordinates to document the areas where there were cedar trees (Thuja plicata) and where there were other trees but no cedar trees present. I then listed off all the coordinates and used a random number generator to select five sites of each type to sample. I planned to walk a number of paces (also generated by a random number generator) from the tree closest to where my GPS said I had reached my destination. This location would be slightly different from where I had taken the coordinates due to GPS inaccuracies caused by the forest canopy (Ordonez Galan et al., 2011). However, I did not take into account the level of imprecision, likely also caused by the tree cover. Instead of taking me to a precise destination as it would in an open area, the GPS only took me to about 20 metres away from the endpoint. To get around this, I began counting my paces from the tree closest to when the GPS had the lowest number of metres left to go. 

The surprising part of the data was that the highest value of biomass collected was from a site with Cedar trees. Sample 3 with Cedar trees had a biomass of 580 g/m2. This value was inconsistent with the rest of the data collected from sites with cedar trees and is 28 g/m2 more than the highest value of the samples without cedar trees. I have gone back to this site and suspect that there are some confounding variables at play here. These variables include the amount of sunlight and the topography of the site.

I will be changing my data collection technique to take these confounding variables into account. To do this, I will ensure that the sites I document with coordinates are not in direct sunlight and have relatively constant terrain (no divots where water could pool). I will then continue to use a random number generator to select the sample sites. Another change that I will be making is to begin taking moisture samples alongside the moss samples. I will choose a day to go out and take soil samples from all the sites. Afterwards, I will weigh them, let them dry out and then weigh them again to find the moisture content.

Bibliography:

Ordonez Galan,C., Rodriguez-Perez, J.R., Martinez Torres, J., & Garcia Nieto, P.J., (2011). Analysis of the influence of forest environments on the accuracy of GPS measurements by using genetic algorithms. ScienceDirect, 54(7-8), 1829-1834

Blog Post 5: Design Reflections

The initial data collection in Module 3 was done on a sunny afternoon. The sampling strategy chosen was to randomly choose ferns using random compass directions and random footsteps between 1 to 15. This was done in each of the areas chosen for study: full sun, partial sun, and shade. The data recorded was the number of fronds on the fern and the length of each frond. The fronds were measured with a flexible tape measure, which allowed for me to measure the frond from the very bottom of the stem to the tip of the leaf. The difficulty in my method of data collection was that I realized just how many fronds that ferns have. I ran out of space in my notebook, having planned for only 10 fronds. I immediately changed my technique when I realized that there were a lot of fronds so I sampled the first ten fronds starting with the frond on top closets to me and then going around in a clockwise direction until I reached that first frond again at which point I went to the second level of fronds and I continued in such a manner until I reached 10 fronds. 

I was surprised that the shaded ferns seemed at a glance to have more numerous and longer fronds. I was similarly surprised that the partial sun fronds tended to have fern neighbors in contrast to the ferns in the sun condition. 

As stated above, I had difficulty with the number of ferns and so adjusted my strategy. While I think that there is some bias in this method, I think that using the same method for measuring fronds will limit the bias. I think that this will improve my research as it means that there is a consistent process for measuring fronds. The randomization of selecting ferns appears to have worked, although I needed to be careful on the steep slope on the west side of the ridge and at times would have to repeat the random selection so I did not walk over a cliff. Otherwise, the method appears to be working well.

Blog Post 5: Design Reflections

I have changed my study topic and will not be carrying out the study that I outlined in earlier blog posts.  My new study will also take place at the Richmond Garden City Lands.  During the implementation of my previous study I noticed that there was a man made walkway through the bog and that there appeared to be more abundance nearer the path.  I have decided to collect samples on a transect. I used five transect lines spaced 5-m apart.  Each transect began on the edge of the man made path and was walked 10-m East into the bog.  The transect was sampled at three random points (1-10 meters from the path).  At each point I placed a quadrant and identified the amount of vegetation covered using a 0.5-mx0.5m quadrant that was gridded to have 25 10-cmx10-cm squares.  I took the pH of from the centre of each quadrant to see if there was an association with pH and vegetation abundance as well.  


I thought that it would be a good idea to do the transect sampling randomly.  By laying out 5 transects and randomizing a number from 1-10 using the generator from random.org.  I have changed my mind on this and will be sampling systematically at three points spaced 5-m apart on each transect.  I decided to change this strategy to make sure that quadrants were not too close to each other so that I could be confident that these samples had independence.   


Collecting this data also made me realize that I lacked focus for a hypothesis.  I found that plant diversity had a more interesting pattern.  There was more plant diversity near the path than there was in the bog.  I think that this is because many plants are sensitive to slight changes in pH and the man-made path brought less acidic soil to the bog.  I think that this is why there is less species diversity further away from the path.  I believe that plant diversity will decrease as the soil becomes more acidic.  The transects will be used in the same design as described above but the predictor variable will be soil pH (or acidity) and the response variable will be plant diversity.

Blog Post 5 – Design Reflections

During the first sampling collection, I used quadrats to sample Aspen trees wanting to determine if younger trees (saplings) were growing towards the field due to the availability of light. My sampling method had some issues that I will resolve by modifying my approach. I found that the Aspen stand was a lot smaller than I had originally determined and that almost 6 of the quadrants did not have any Aspen in them which would have skewed the data. Furthermore I was only sampling one tree per quadrant and this would not have produced enough data.

Moving forward I will be using a random sampling method using transects from the field into the forest. I will start with steps from the southwest corner of the field and sample at 1m, 9m, 17m, 25m and 33m distance from the field. I will also split my sampling into mature (breast height circumference over 10 cm) and young  ( breast height circumference under 10cm) and new shoots (under 2cm). This will ensure that I can determine the the average number of trees per square meter in each part of the forest sampled for both young and mature trees.

Post 5: Design Reflections

Previous data collection method

I used random.org for all my random number-generation. In my methods descriptions below, I will put the parameters for the generated number in brackets.

For my recent field observations, I decided to use simple random selection to choose sampling sites. I chose my starting point by walking 20 paces (10-30) north of the steps up to Volunteer Park. My process for determining the actual sample sites required me to be able to move in any direction, so it was important to have a starting point that was not on the edge of the beach.

Each new sampling site was chosen in a two-step process. I generated a number to indicate direction (1-4, where 1 = northwest, 2 = northeast, 3 = southwest, 4 = southeast), then generated a number of paces (5-15) to walk in that direction to take another sample. I repeated this procedure 10 times, more than the required 5, because the first five samples had no oysters at all (an early sign that the method would have to be modified).

At each sampling site, I recorded whether or not there was a large rock present (as a yes or no), and how many oysters I saw within the quadrat (oyster numbers broken down into two categories, attached and unattached).

Difficulties in implementing that sampling strategy

With my previous sampling strategy, each sampling site basically fell into one of four possible categories:

Notebook Scan on Feb 23, 2021 at 19_32_24


Almost all of my sampling sites were in the bottom right quadrant – they had neither rocks nor oysters. If I was seeking to measure the density of the oysters on the beach, those would be useful data points, but I am primarily interested in whether oysters are more likely to be near large rocks. Upon reflection, even the bottom left quadrant – rocks but no oysters – is not relevant either, because my question isn’t “are rocks more likely to have oysters nearby?” (which is superficially similar to “are oysters more likely to be near rocks?”).

I also was not leaving markers of where I had previously sampled, and my randomization method did not account for or prevent me from going back over previous areas. Since I was equally likely to go south or north, east or west, on average I was generally staying in the same place.

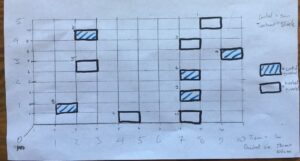
I diagrammed my movement using my notes, and it’s clear that some sampling sites were very close together. With more options for directions, eg. including north, south, east and west (so 1-8), I probably would have been less likely to ever immediately backtrack, but still equally likely to circle back to the same places. Although my previous strategy was random, I don’t think the sites were all sufficiently far apart to be independent.

Modifications to sampling strategy

Going forward, I will change how I randomize (for better independence) and what specific information I collect (to better address the research question).

Randomization

I will first measure out a section of the intertidal zone in paces, and then diagram it in my field journal. From there I can generate a set of x- and y-coordinates using random.org with the parameters I just measured. I’ll place those coordinates on my diagram in order, and eliminate any that are within a certain number of paces of a site that’s already on the map. I’ve drawn up an example of how this might look.

Data collection

At each sampling site, I will look for the nearest oyster. I will then record whether it is close to a large rock, or not. I believe this will better address the research question, because each oyster will be the sampling unit and the recorded information will then allow me to compare the number of oysters near rocks versus the numbers not near large rocks. To note any potentially confounding variables, I will also record whether that oyster is attached or not (in case attached oysters are more likely to be on rocks than unattached), and measure the oyster’s size.

Surprises in data collected so far

In the data I have already collected, using the previous sampling method, only four samples even had oysters present. Contrary to my expectations, half of the sampling sites that contained oysters did not have any large rocks. The most oysters found at one site (6) were found in a clear space without rocks.

I am not going to draw any conclusions from that information because, as discussed above, the method for collecting the data was flawed, and I don’t think four data points are sufficient.
Post 5: Design Reflections

The data that I collected in Module 3 did prove to be interesting. I was unsure how many birds and how many different species I would be able to observe in the hour and 15 minutes that I conducted the data collection. I saw four different species, three of which I was able to identify immediately, and one that I was able to later identify. I would consider this one difficulty in the study. I knew that I would of course not know all local species going into this study, but was unsure if I would be able to properly identify any that I did not already know. On this day, I was able to take a few photos of the species that I was unable to identify, which made it significantly easier in identifying at a later time with more resources.

The location where I collected the data was at Location A of my test site, which is where I anticipated finding the most variety of bird species as well as abundance. At this location there is a clearing with bird feeders. There are also park benches, and therefore tends to have more people present. On the day where I collected data, it was not only raining, but I collected data at 8am. I saw very few people, which may have affected the bird’s behaviour or presence.

I did choose to modify my approach in that in my full field research for this assignment, I observed the number of species and their abundance at three separate locations, points A, B, and C. The proximity to the bird feeders, to more human traffic, and to a clearing in the forest all the three variables which I chose to observe for this study. The sampling technique proved effective. I was not observing the location for so long that I lost patience, concentration, or interest. I think an hour of observing each day is an appropriate and sustainable amount of time to allot to the observations.

Blog Post 5: Design Reflections

Sample Date and Time: 2/7/21 10:40AM

For my initial sampling, I chose to use the systematic sampling method utilizing five 0.25 m2 quadrats spaced approximately two meters apart along a transect that ran in the heading of 110 degrees for approximately eleven meters. This transect was placed along my initially observed gradient of elevation from sea level. My initial sampling location was along the western rocky outcrop of the headland island. Within each quadrat, percent cover was recorded and indicated with one of five classes of percent cover ranges.

The most obvious difficulty for sampling the abundance of the stonecrop is and will be the accessibility to the sample points. As the stonecrop appears most abundant on the steeper rocky faces, some sample points may not be accessed safely and easily. When placing additional transects within each study area, this will have to be accounted for while trying to minimize sampling bias. Repeat transects within each study area will help minimize any bias from adjusting the transect locations.

My initial data collection generally agreed with my initial hypothesis that stonecrop abundance is negatively affected by increased substrate moisture as a higher abundance was measured at areas with well-draining, rocky substrate. However, it was noted that substrate alone may not be the best indicator as two samples that had rocky substrate had very little to no abundance of the stonecrop. It was also noted that the substrate type was generally consistent throughout the entire transect indicating that either a better predictor variable is needed or the transects should be longer (i.e run farther inland). The absence/presence of moss on the rocky substrate or degree of slope seem to be better predictors based on this initial sampling.

Going forward with full sampling I will continue to use transects and quadrats as these seem to be the most effective and efficient methods to capturing stonecrop abundance. Transect lengths will be increased which will necessitate additional quadrats. Each of the three study areas will have five transects with evenly spaced quadrats along each transect. An additional alteration will be to the percent cover classes used as my lowest class used (0-20%) may be too large a range to capture very small abundances.

Blog Post 5: Design Reflections

Previously I had been gathering raw data on mole hill activity and predator signs in a 1km x 1km area in western Ukraine. This area was divided into zones each with distinct boundaries and each with a mole colony. The northern half of the area has increased feral canine and stray cat activity.

The intent is to use the data to determine its effect on my null hypothesis, “The number of predators in a given area does not affect the activity of mole colonies in the same area.”

Initially I was using a haphazard sampling technique but had to refine it in order to capture moving pr

Example of Zone observations
Fig 1. Example of Original Zone observations

edators. The original sampling technique worked well to capture mole activity via the count of new mounds, but failed to be consistent in how predators were recorded.  The initial counts were also difficult to conduct because of the duration I was spending at each of the approx. 12 zones. This took most of the morning each day since I was gathering a large amount of spacial data. The time expenditure was significant. There was additional difficulty as I needed to gather data along a chronological gradient. Since the activity of the predators appeared to ebb and flow I also realized that this would need more than a single day of data gathering to do a comparison.

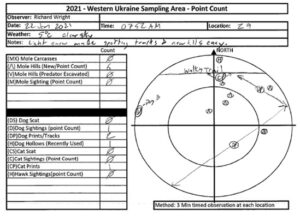
I wanted to capture statistically relevant data, so that I could determine if there was a correlation between these two data points. My solution was to pivot and use a point count with a 3 minute waiting period before moving on to the next location on the route.

This method would be more beneficial as the time frame would give me an opportunity to not only be consiste

New method of sampling
Fig 2. New point count method of sampling.

nt in the time of recordings, but also expedite my data collection.

After doing this I graphed some of my data and was surprised that there may (initially) be a correlation between canine predator activity and mole hill activity.

Continuing forward, I will collect data using the point count system. My hope is to do a week or two of data collection each morning to capture both the fluctuations in mole and predator activity. This alteration in data collection should improve consistent precision in my data gathering while reducing time spent.

I am looking forward to collating all of the data and seeing the results.