While conducting the field research on moles and their predators, I learned a great deal more than I expected about research techniques and ecology.
It was necessary to change my design a few times, as I acquired feedback from my instructor. Primarily the adjustments included how to conduct the samples in an accurate manner, and how to gather data efficiently while ensuring replicates were conducted to limit the possibility of errors due to small sample sizes. In retrospect I may have complicated my project by selecting a predator and prey model rather than something more simplistic such as non moving organisms like grasses or lichen in microhabitats. Regardless the challenge (and fun) was to find a way to sample my communities accurately.
Participating in this course and engaging in these activities has given me an appreciation for ecology. The rich complexities of how sampling, research, statistics, natural history, geography and even geology are brought to bear on a problem.
While I do not consider myself an ecologist, I have enjoyed the process and will likely look at the natural world differently now. The blessing in all of this has been that I have learned some basic tools on how to see how communities interact and have a new found appreciation for ecology.
After entering my data into excel I found that it was difficult to display the data as a whole without breaking out the separate data sets gathered. Since I had gathered information on predators and a separate group of data on prey, I had to find a way to display this in a way that showed the relationship. Eventually I settled on the average of the number of signs of predator activity and also the average number of signs of prey activity.
The result in graph showed an immediate trend between the two, and I was pleasantly surprised to see how clear the relationship was. However, I also had to reconcile that I had gathered only a single weeks worth of data from 35 point counts (Conducted each day). While there was a lot of separate data to draw from I realized that a longer term study over a month or two in less areas may have given my data more weight and allowed me to see a more longer term trend such as is predicted in Lotka-Volterra models.
Overall, even with a shorter time duration of data gathering, I came away with a better understanding of why long term studies really hold alot more weight than shorter duration studies.
My research project looks at the expansion of a stand of Trembling Aspen Populus tremuloides into a field at Campbell Valley Park in southwestern BC. I chose to sample using transects along 2 randomly drawn locations along the field started from the side of the stand. With 5 sampling points along the transects and trees sampled in each “quadrant”, I took 40 replicate samples. The sampling was fairly straight forward, but I did not expect to be caught up in so may dried blackberry bushes!
I originally chose this location last year when the leaves were on the trees and the forest was dense. I have now gone back to do my sampling and the forest and trees look much different in the winter. The soil was dry then and now it was very moist and even saturated in some sampling points. Since the forest was also bare, I could see different patterns that were not as clear in the winter. While I still think the Aspen are growing into the field, since this is the only location where the stand can expand (the back is paved and there is a trail to one side), there may be more environmental drivers behind this. I will now have to look at my data and see if my hypothesis of a higher density of younger trees near the forest edge is shown.
My research project is examining the expansion of a stand of Trembling Aspen Populus tremuloides into a field at Campbell Valley Park in southwestern BC. According to some preliminary research I have done soil quality, sunlight availability (Romme et al., 2005), climate change, fire suppression, grazing and human interactions (Widenmaier & L Strong, 2010) are all potential factors for tree encroachment. The Aspen tree is one of the most common deciduous trees in North America and can reproduce asexually producing shoots that travel under the soil and produce cloned trees as large in area as a few acres(Mitton & Grant, 1980). Aspen are considered early succession species that take advantage of disturbed environments (Romme et al., 2005). Therefore, some keywords that would describe my research project would be early succession, tree encroachment, environmental gradient.
References:
Mitton, J. B., & Grant, M. C. (1980). Observations on the Ecology and Evolution of Quaking Aspen, Populus tremuloides, in the Colorado Front Range. American Journal of Botany, 67(2), 202–209. https://doi.org/10.2307/2442643
Romme, W. H., Turner, M. G., Tuskan, G. A., & Reed, R. A. (2005). Establishment, Persistence, and Growth of Aspen (Populus tremuloides) Seedlings in Yellowstone National Park. Ecology, 86(2), 404–418.
Widenmaier, K. J., & L Strong, W. (2010). Tree and forest encroachment into fescue grasslands on the Cypress Hills plateau, southeast Alberta, Canada. Forest Ecology and Management, 259(10), 1870–1879. https://doi.org/10.1016/j.foreco.2010.01.049
I am curious if the level of predator activity in an area affects the activity of a mole colony in the same area.
There are preceding works that provide a theoretical basis for my hypothesis. Some propose the use of models such as the Lotka-Volterra Model (Abrams, 2000) to show the relationship between predator and prey. This body of research creates an architecture around how to model predator and prey communities. The intent of my research is to identify if a relationship exists, and possibly what influences there may be on the communities in the WURA. Previous research paper’s such as this allow me with a basis on which to compare and contrast my own methods and results.
The focus of the research is on feral canines and feral felines acting as predators on eastern European moles in a semi urban setting. Some key words specific to my research project would be:
Mole
Canine
Predation
——————————————
References:
Abrams, Peter A. “The Evolution of Predator-Prey Interactions: Theory and Evidence.” Annual Review of Ecology and Systematics, vol. 31, 2000, pp. 79–105. JSTOR, www.jstor.org/stable/221726. Accessed 9 Mar. 2021.
During the first sampling collection, I used quadrats to sample Aspen trees wanting to determine if younger trees (saplings) were growing towards the field due to the availability of light. My sampling method had some issues that I will resolve by modifying my approach. I found that the Aspen stand was a lot smaller than I had originally determined and that almost 6 of the quadrants did not have any Aspen in them which would have skewed the data. Furthermore I was only sampling one tree per quadrant and this would not have produced enough data.
Moving forward I will be using a random sampling method using transects from the field into the forest. I will start with steps from the southwest corner of the field and sample at 1m, 9m, 17m, 25m and 33m distance from the field. I will also split my sampling into mature (breast height circumference over 10 cm) and young ( breast height circumference under 10cm) and new shoots (under 2cm). This will ensure that I can determine the the average number of trees per square meter in each part of the forest sampled for both young and mature trees.
“The level of predator activity in an area does not affect the activity of a mole colony in the same area.”
Field Data Collection Activity:
Field data related to mole colonies and predators continues as I refine the process by which to conduct the collection. Originally I had intended on selecting a set mole colony inside of the Western Ukraine Research Area (WURA). However, the grid layout and detailed counts became unwieldy as I noted that the feral dogs would intrude during the longer time taken to gather data.
I altered my plan by researching point counts and how to conduct them in order to capture accurate information. Included in this process I laid out a routine path along which I will be conducting my data gathering. This consistency will improve the accuracy of my data.
Already I have tested this out and am using 10 replicates along a sampling route in the WURA. The intention is to do this for the next ten days in order to get the magnitude of data needed for a statistically relevant study. There will be ten repeats of the sampling process giving us 100 samples to work with.
Initial survey results show that there may be a correlation between predator activity and prey (mole) activity, but more data is required as ‘correlation does not imply causation’, especially in such a small sample count. It would be easy to jump to a biased conclusion before the data is completed.
Another alteration to my plan, is to identify the mole colonies as individual colonies rather than the zone identifications. Some colonies are in the same zones, so I will be labeling them as their own independent colony moving forward.
I am excited to continue the research project as I feel I now have an effective sampling method and there is a great deal of confidence that it will work well for what I need.
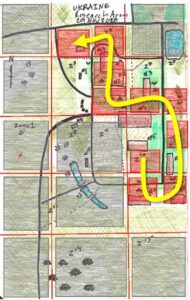
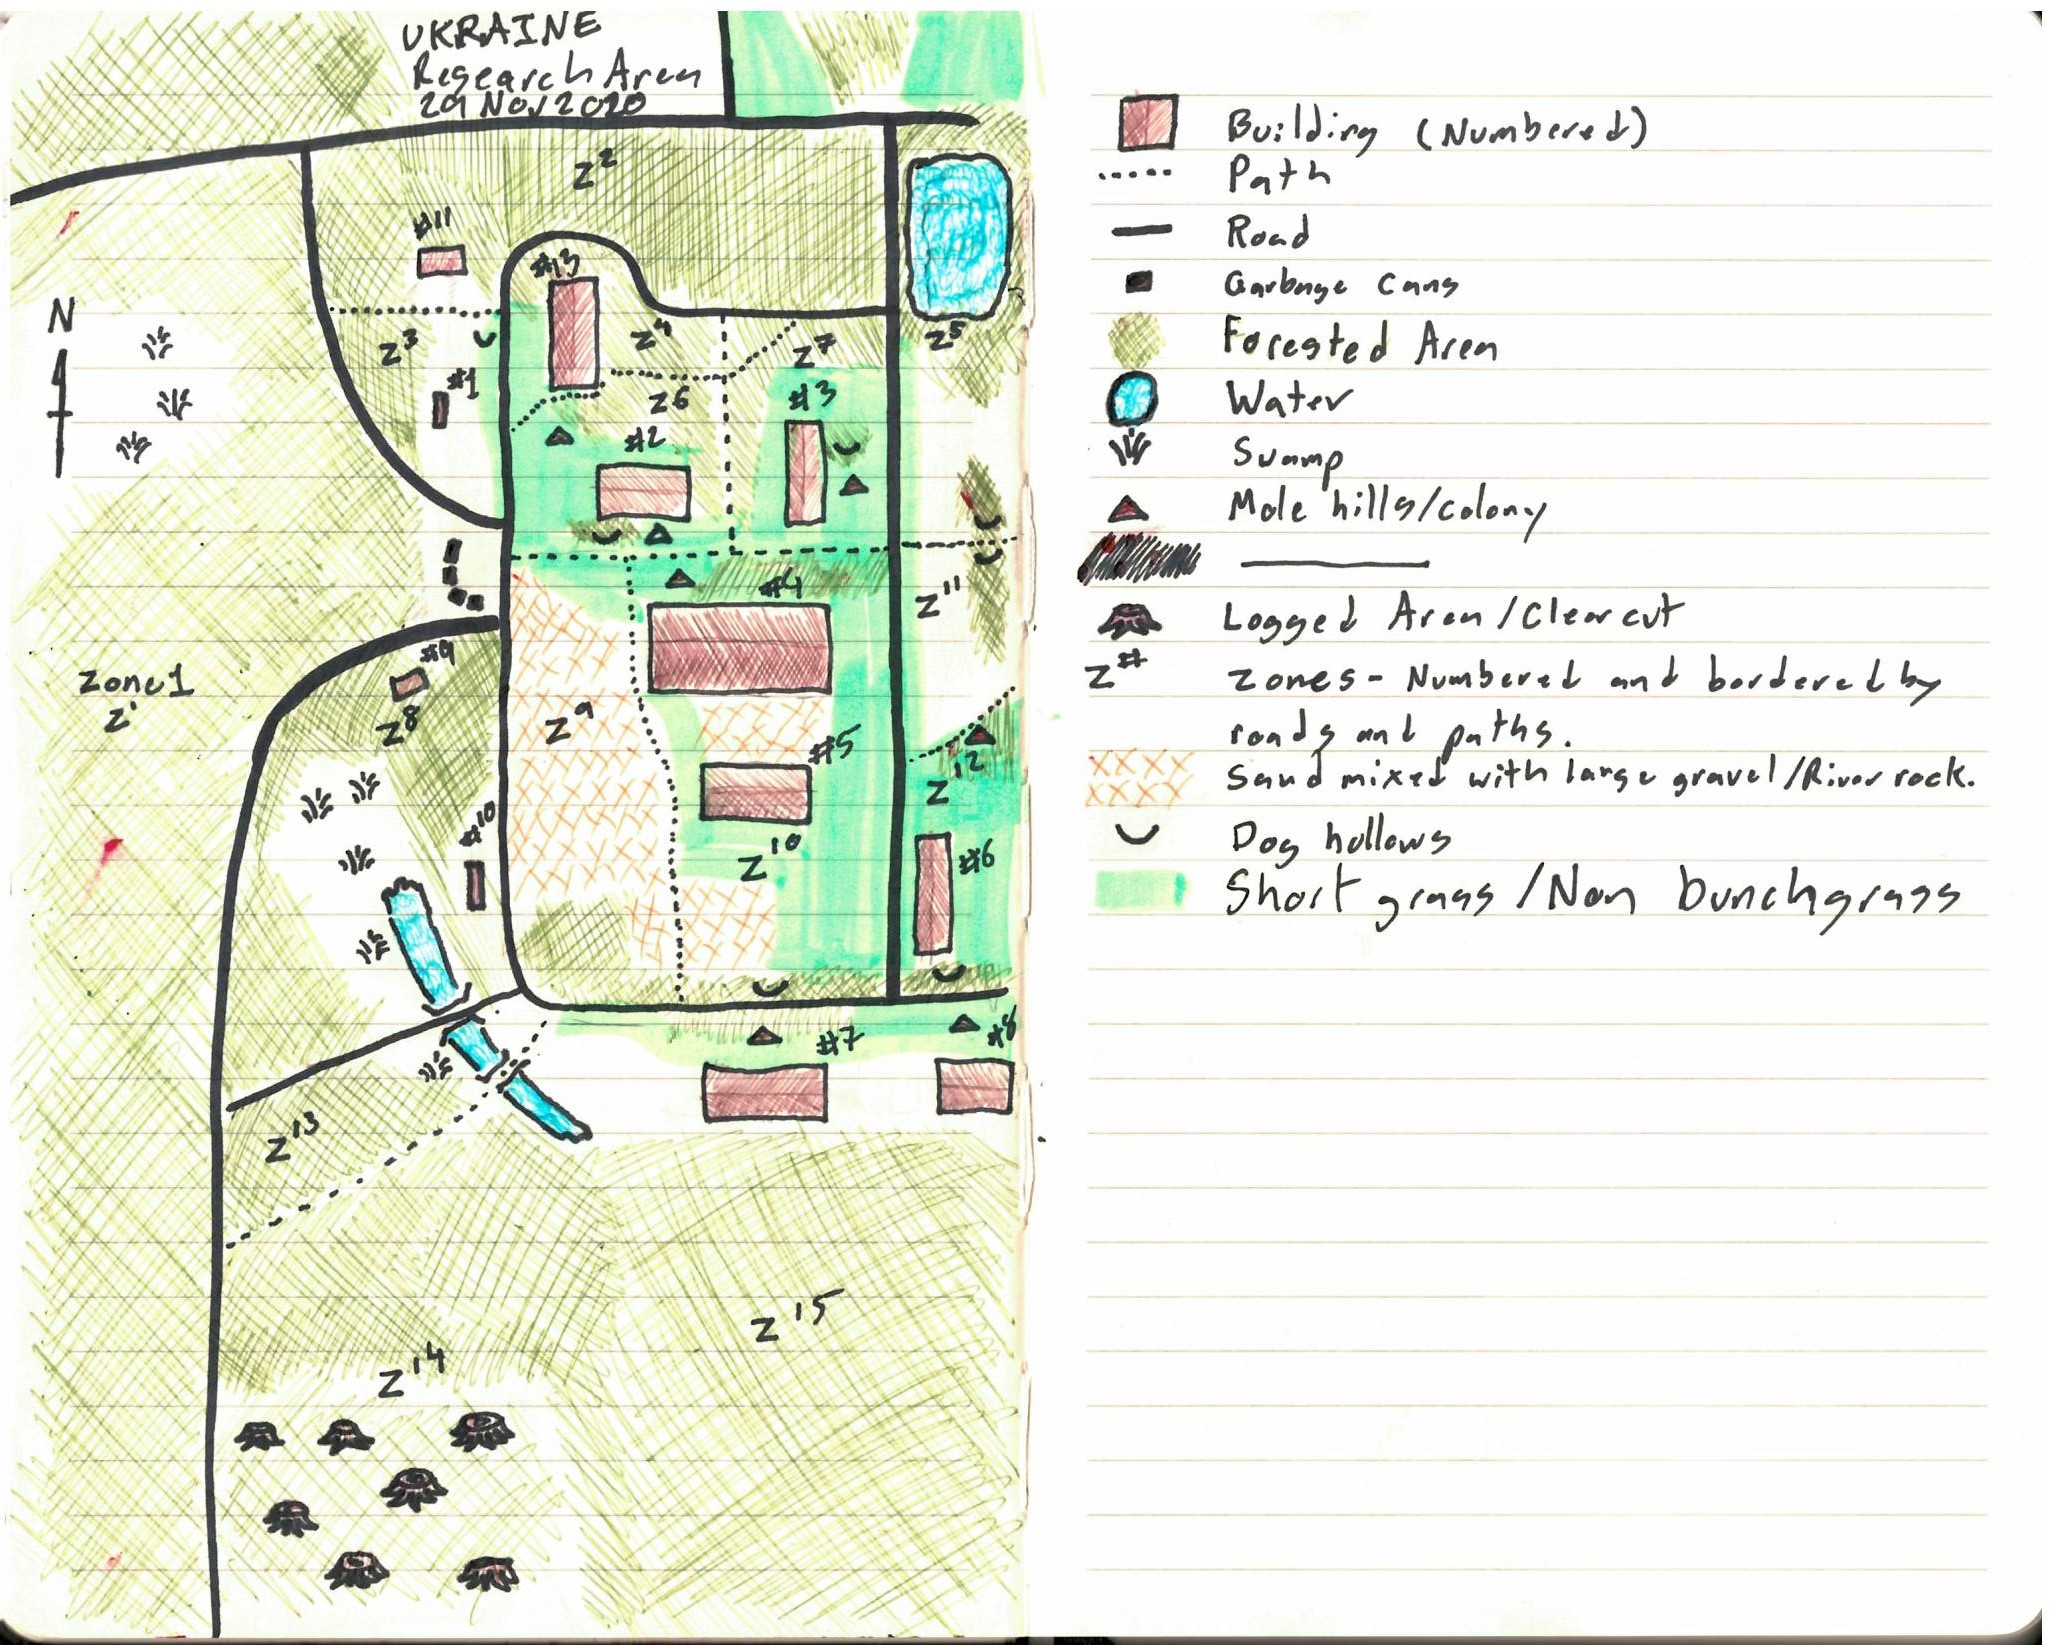
Previously I had been gathering raw data on mole hill activity and predator signs in a 1km x 1km area in western Ukraine. This area was divided into zones each with distinct boundaries and each with a mole colony. The northern half of the area has increased feral canine and stray cat activity.
The intent is to use the data to determine its effect on my null hypothesis, “The number of predators in a given area does not affect the activity of mole colonies in the same area.”
Initially I was using a haphazard sampling technique but had to refine it in order to capture moving pr
Fig 1. Example of Original Zone observations
edators. The original sampling technique worked well to capture mole activity via the count of new mounds, but failed to be consistent in how predators were recorded. The initial counts were also difficult to conduct because of the duration I was spending at each of the approx. 12 zones. This took most of the morning each day since I was gathering a large amount of spacial data. The time expenditure was significant. There was additional difficulty as I needed to gather data along a chronological gradient. Since the activity of the predators appeared to ebb and flow I also realized that this would need more than a single day of data gathering to do a comparison.
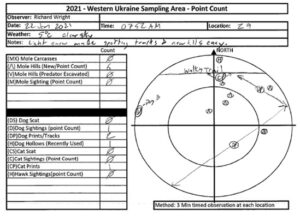
I wanted to capture statistically relevant data, so that I could determine if there was a correlation between these two data points. My solution was to pivot and use a point count with a 3 minute waiting period before moving on to the next location on the route.
This method would be more beneficial as the time frame would give me an opportunity to not only be consiste
Fig 2. New point count method of sampling.
nt in the time of recordings, but also expedite my data collection.
After doing this I graphed some of my data and was surprised that there may (initially) be a correlation between canine predator activity and mole hill activity.
Continuing forward, I will collect data using the point count system. My hope is to do a week or two of data collection each morning to capture both the fluctuations in mole and predator activity. This alteration in data collection should improve consistent precision in my data gathering while reducing time spent.
I am looking forward to collating all of the data and seeing the results.
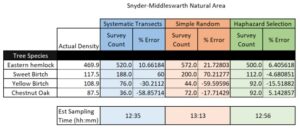
After completing the virtual survey of the Snyder-Middleswarth Natural area, there were some interesting observations in regards to the time and accuracy for each sampling method in relation to the population density.
Fig 1.0 – Survey Stats
OBSERVATIONS REGARDING DATA:
The technique which had the fastest estimated sampling time turned out to be the systemic transects at 12 hours and 35 minutes.
The percentage of error was lowest with the haphazard selection. This was surprising because it allows for inherent bias. When I conducted the virtual selection of survey quadrats, 5 locations were selected in the medial aspect of each topographical section, and spaced equally from west to east. This way a similar sample location was chosen along each topographical feature.
The fact that this was the lowest percentage of error is surprising as I was worried my bias would affect the outcome, but apparently because I applied a system it actually negated an increase in error.
The species abundance also affected accuracy. As the abundance decreased, we saw a decrease in accuracy. The accuracy could likely be improved with an increased sampling size. With any sampling, the lower sample size runs a higher percentage of error.
Overall the haphazard selection appeared to be more accurate than others, but likely due to the systematic bias I introduced by surveying plots equally distanced from one another in an almost grid shaped pattern.
For the course project I have been gathering data on the ecology and communities of a 1km x 1km area in western Ukraine. The following information contains both my ongoing field observations and my considerations regarding a possible hypothesis.
Organism or Biological Attribute:
For the course project I have chosen to study the Eastern European Mole, and how it interacts with local predators such as dogs and cats.
Documentation:
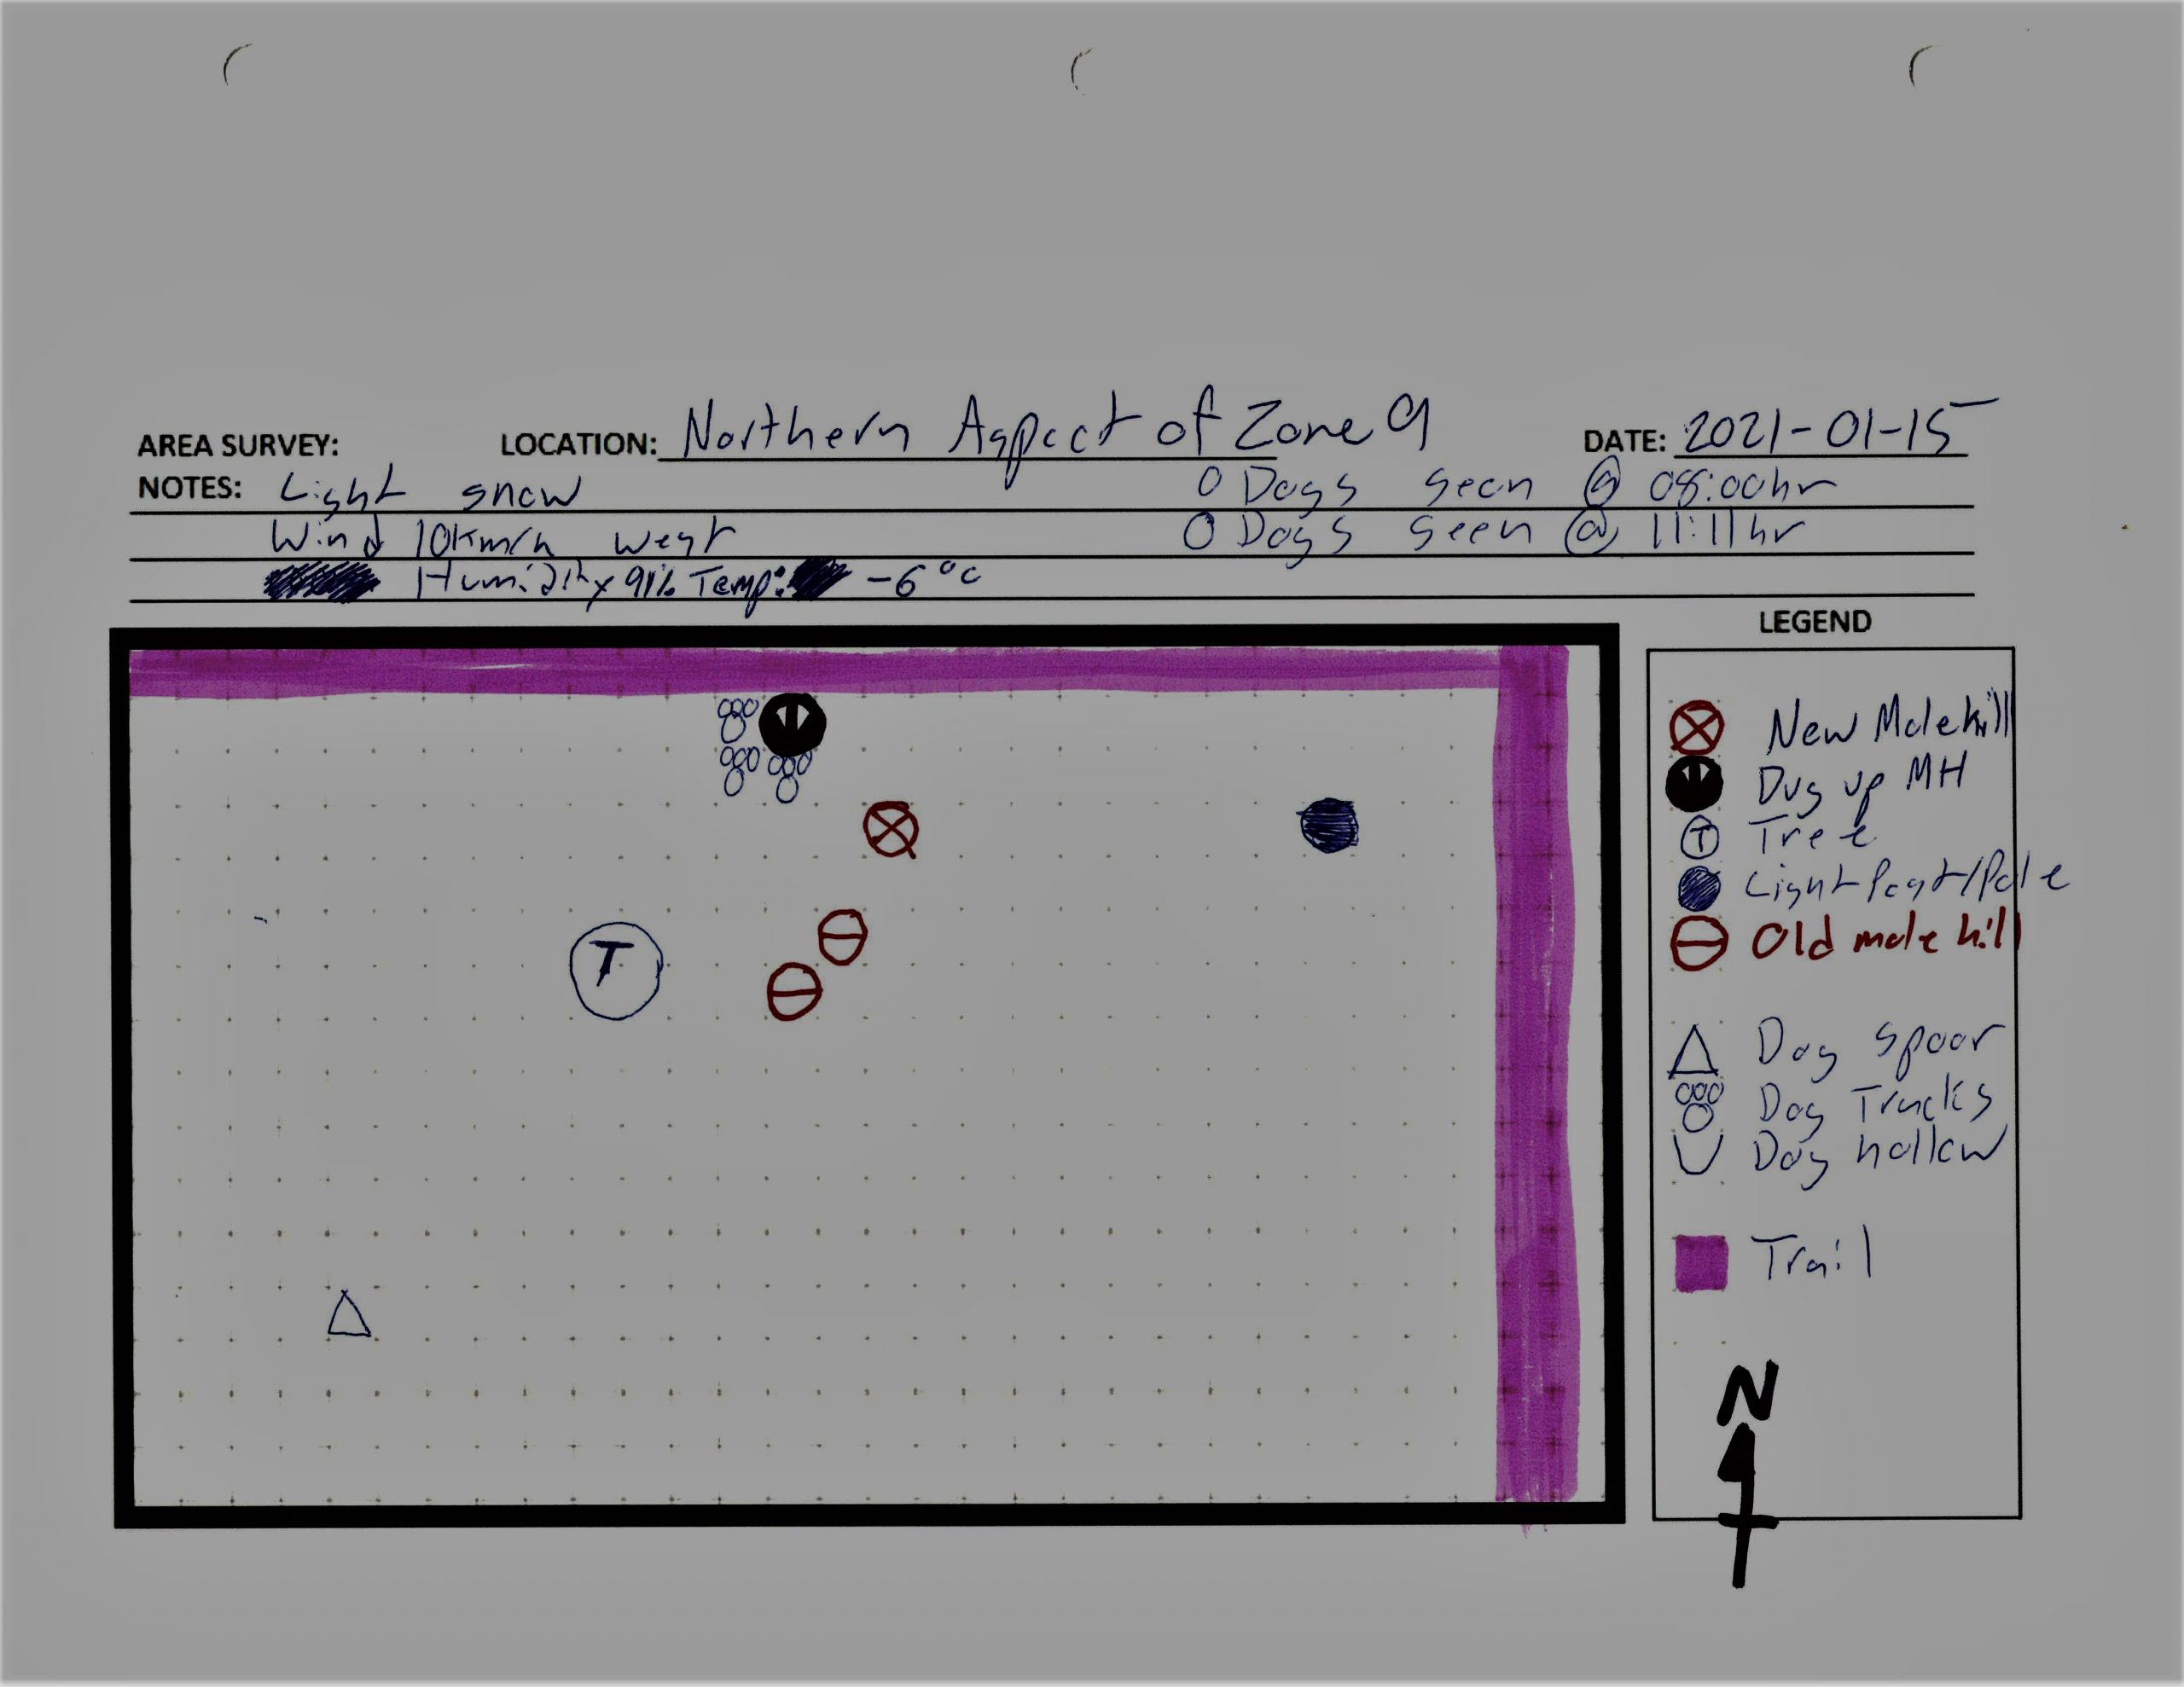
I have been observing and documenting mole colonies, dog sightings, cat sightings, weather conditions, and mole hill activity over the last month in the observation areas. Specifically Zone 9, Zone 15, Zone 12, and zone 7. Contrasting to this, there is a single Zone I have been documenting called ‘Control zone’ east of the observation area which has no Canine or Cat activity observed.
Example of Zone observations
Gradients Observed:
TOPOGRAPHY: In the control area, there is a gradient of topography with approximately a linear grade from the southern aspect dropping approximately 12 feet to the northern most aspect. Of note there is approximately an 8 foot gully near creek on western aspect of observation area.
VEGITATION: The general area which the moles are observed is the grassed areas which sit on a sandy aggregate soil.
PREDATORY CONCENTRATION: There appears to be a higher concentration of predators in north western aspect of observation areas, but less in south eastern area either due to topography, territorial behavior, access to food, or a combination there of.
GROUND: Keeping in mind soil types change throughout the area. Again, the mole hills appear in sandy soil but the depth gradient of tunnels is not able to be directly observed despite the research on moles that indicates that these can go as deep as 6 feet. There is a carpet of decomposing leaves and rich soil under the oak trees (often thick with acorns) but little to none under pine trees.
TEMPORAL: Over time the count of active mole hills, spoor, coil conditions, and weather changes which may affect activity levels of all organisms in observation area.
Three locations inside the Observation area are:
——————————–
North west aspect of Zone 9 – Medium to low dog activity in area/transit point no sleeping
Northwestern Aspect of Zone 15 – Low dog activity in area as they adhere to eastern aspect for midday sleeping.
South eastern aspect of Zone 7 – High Dog activity due to transit+sleeping area
Central area of Zone 12 – Low mole hill count, high dog activity during midday.
Control area: Zero dog/cat activity – Zone A (east of map)
Area of Observation
Processes and Patterns
Anecdotally the mole hills appear more populus and active in zone 9 and 15, as well as the control area to the east. This seems to be inverse to the dog activity in those areas. The temperature changes over time seem to affect the mole activity to some extent.
Hypothesis
The number of predatory dogs and cats in the area directly effects the activity of the colonies in the observation area.
Response variable(continuous): Mole hills along the gradient of dog activity.
Explanatory/Predictor variable (continuous): Number of dogs in the area (based on sightings and new signs)
Initially this appears that a study for this hypothesis would be of a regression design