Blog Post #4 – Sampling Strategies

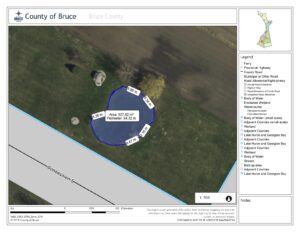
For sampling simulation of Snyder-Middleswarth Site using area-based sampling.

The fastest estimated sampling time was haphazard sampling at 12 hours and 27 minutes, 11 minutes faster than random and 9 minutes faster than systematic sampling.

Eastern Hemlock (common): haphazard – 2.9% ; random – 26.4% ; systematic – 12.3%

Red Maple (common): haphazard – 8.7% ; random – 12.1% ; systematic – 12.5%

Striped Maple (rare): haphazard – 65.7% ; random – 138.3% ; systematic – 8.6%

White Pine (rare); haphazard – 50.0% ; random – 100% ; systematic – 100%

Most accurate sampling strategy for common species (Eastern Hemlock and Red Maple) is haphazard sampling, and the most accurate for rare species (Striped Maple and White Pine) is also haphazard sampling. In this case, haphazard sampling was more accurate compared to random and systematic.

Accuracy, in general, was better with species that are more common, and worse with species that are more rare. The accuracy decreased for rare species as all percentage errors for each of the three sampling techniques increased.

24 sampling points is not a sufficient number of sampling points. With the abundance of each species varying greatly throughout the study area, only having 24 points doesn’t properly represent the number of species. There are a lot of missed species.


Post 2: Sources of Scientific Info by E. C. Bell

Plants of Coastal British Columbia including Washington, Oregon and Alaska; was written and contributed to by ten notable authors, compiled and edited by Jim Pojar and Andy MacKinnon, whose design was to present an accessible ecological guide to the plants of this specific region. It is a comprehensive guide that includes photos and descriptions of flora, organized in a manner that groups similar species for the purpose of identification. Information on human interactions with the flora is included with the plants’ ecological descriptions, the entire works is engaging and systematically accessible.

Funding for the publication of Plants of Coastal British Columbia including Washington, Oregon and Alaska was provided for by the British Columbia Ministry of Forests and the Canada-British Columbia Partnership Agreement on Forest Resource Development. The publisher, Lone Pine Publishing, acknowledged the assistance of Alberta Community Development and the Department of Canadian Heritage with additional funding provided by the Alberta Foundation for the Arts.

According to the Flow chart for discriminating among different sources of information, Plants of Coastal British Columbia including Washington, Oregon and Alaska begins to qualify as a research material because the majority of contributing authors are affiliated with departments of speciality within Canadian universities or the British Columbia Forest Service (p. 527). I did not find any in text citations, however, there is an extensive list of References Cited, as well, direct acknowledgement is given to “knowledgeable Aboriginal botanists from the First Nations of the Northwest Coast and neighbouring areas…” (Pojar and MacKinnon, p. 7). Beyond the editing of Pojar and MacKinnon, there was a technical review of portions of the text by George Douglas and Chris Marchant (p. 7). Because this compilation is not a scientific study and, therefore, does not include a “methods” or a “results” section, I believe Plants of Coastal British Columbia including Washington, Oregon and Alaska to officially be an academic peer-reviewed review material. The following pictures are meant to provide the documentation needed to support my designation of Plants of Coastal British Columbia including Washington, Oregon and Alaska as an academic peer-reviewed review material because they show the text claiming technical revision and reveal the qualifications of the authors. Unofficially, I have many years of pouring through the water resistant pages of Plants of Coastal British Columbia including Washington, Oregon and Alaska, considering it and others in the series dedicated to the different ecoregions of British Columbia, to qualify as researched reference material.

Blog Post 4: Sampling Strategies

The virtual forest tutorial utilized three sampling strategies;

(1) Haphazard Sampling,
– Uses samples that are most readily available, usually not random

(2) Systematic Sampling,
– Uses samples from a larger population, random starting point with fixed pattern

and (3) Random Sampling
– Chosen randomly, allows for equal opportunity

The most time efficient sampling from fastest to slowest are Haphazard Sampling, Systematic Sampling and then Random Sampling. Accuracy of the sampling was dependent on what was being examined. For example Systematic Sampling was most accurate when studying the two most common tree species. Whereas Haphazard worked best for the rarest species. Overall the Haphazard Sampling was most effective for this tutorial.

Blog Post 3: Ongoing Field Observations

The main species in focus for my research will be Cattails and Lily Pads, and how they can become invasive to other species, as wells studying best practise pond management techniques. I am interested to see how the presence and density of either cattails or water Lillies or both effect the density of other species in the pond. In the past several years our pond has become extremely overgrown, the growth of new trees surrounding its perimeter. Alongside the massive increase in cattails and lillies. Below are air photos of the pond from 2010 (Figure 1) and 2015 (Figure 2). As you can see in just 5 years the amount of vegetation has doubled. To some property owners this may be an “eye sore,” however, my family does not mind. As the pond continues to evolve the amount of species that inhabit and utilize it as a resource have increased. The new trees surrounding the pond provide habitat for more bird species. As the weather continues to grow colder we will soon be having many Canadian Geese as visitors.


Figure 1: 2010 Air Photo of Pond


Figure 2: 2015 Air Photo of Pond

I am still brainstorming a concrete hypothesis but it will largely surround habitat space use from varying species in our pond and how the presence of one may effect another. Below are initial notes taken on October 4, 2019 along with photos of my study areas. (Figure 3- ). The graph in Figure 3 exemplifies a visual representation of the space utilized by varying factors in the pond, I will soon create a chart and more accurately record this data. Also note I am still working to identify two of the tree species. The drawing in Figure 4 represents how my study is going to be divided directionally, taking into account wind patterns, tree locations and how the pond is utilized by which species in each specific location.


Figure 3: Initial Field Notes – Part 1


Figure 4: Initial Field Notes – Part 2


Figure 5:


Figure 6:


Figure 7:


Figure 8:

Blog Post #3 – Ongoing Obs.

I revisited the park Oct 11, 2019 at 2:13pm. The temperature was 6°C and humidity at 42%. From my previous observations, the trees looked different in all areas of the park, some were decaying while others are still mostly green. Hence, I have chosen the study how the temperature, and especially the humidity from changes in weather, are going to affect the changes in certain trees. there are three deciduous trees, comparable in size and all quite bigger than the other trees, all located along the North side of the park.

Hypothesis: The colder and dryer the weather gets over the course of Autumn, the more the leaves of the trees will change.

Prediction: As the weather gets colder and dryer, then all the leaves in each of the three trees should change at approximately the same rate.

Response Variable: Amount of color change in leaves in each tree. It will be a continuous variable as the amount of color changed leaves from green to yellow is a % of all the leaves on the tree.

Explanatory Variable: Level of humidity. It is a categorical variable as humidity will be placed in low (< 30%), medium (30-70 %), and high (>70%) levels.

Tree 1
Tree 2


Tree 3

Blog8 Table and Graphs

Blog 8; Table and Graphs


October 12, 2019


For my field research study I created a table and a figure from the data I collected. When I collected the data I used two categorical variables. The first was the presence\absence of Hydrocotlye heteromeria in each of the quadrats I examined. The second categorical variable I used was wet\dry plot. I determined how many of the quadrats had the presence or absence of the species in each of the wet and dry plots. Since I am using categorical variables, and my study is a snapshot, natural experiment with 2 categorical variables I used a tabular method to determine my data.


I created an “Observed” data table including totals what the actual data I examined. I also developed an “Expected” data table and totals. I needed to create an expected data table to determine what I should have expected if the variables were unrelated. The “Expected values are what would be expected if the Null hypothesis were true and the variables were independent of one another. I then performed a Chi statistical test to determine if the relationship between Hydrocotyle and soil moisture levels was statistically significant. I determined that there is evidence that Hydrocotyle heteromeria is limited by soil moisture levels.


I also used the percentages of Hydrocotyle presence and absence that I found from each of the plots to create a figure. The figure is an easily identifiable way to quickly check how the counts and variables in the data table relate to one another.


The only problem I encountered when doing the table and the graphs was the fact that the course actually didn’t contain any material on how to process data information depending on which of the study methods we chose to use. I had to consult the professor of the course to determine the correct statistical test needed to analyse my study data. The table information and statistical testing was fairly straight forward after I completed the data counts. The outcome of the research is exactly what I had expected after reading literature. Hydrocotyle is limited by soil moisture levels. I didn’t take into account the nutrient levels in this study, but I would however like to learn more about their effect on this interesting species.

Blog Post #2 – Source of Scientific Info

The source I found is “Reverse chemical ecology: Olfactory proteins from the giant panda and their interactions with putative pheramones and bamboo volatiles”, published in 2017 by Jiao Zhu, Simona Arena, Silvia Spinelli, Dingzhen Liu, Rongping Wei, Christian Cambillau, Andrea Scaloni, Guirong Wang, and Paolo Pelosi.

Link can be found : https://hal.archives-ouvertes.fr/hal-01802949/document

This article is an academic, peer-reviewed, research article. It is an academic article because it is written by experts of that field, includes in-text citations throughout the article, as well as a bibliography at the end of the article. Stated near the top, the article was received for review before being approved, making this article peer-reviewed. And finally, since the article does have a detailed methods section to test their hypothesis, as well as a results section, this makes it a research article.

Blog Post #1 – Observations

The area that I have selected to study is the oldest city park located in the heart of downtown Calgary, AB. I’ve chosen this area because it is easily accessible and I can visit when needed. It is often frequented by humans and animals (ie. dog, squirrels, and birds) alike.

The approximate size of the park is 100m x 170m (the average block size in Calgary), and is about 2 hectares (according to The City of Calgary). The park is flat with ornamental trees, shrubs, and seasonally planted flowers (all of which have been taken out now). It also has pathways, both concrete and rock, and houses a few monuments, two fountains and a library.

I visited the park Oct 9, 2019 at 4:00pm. The weather was sunny and cloudless with a slight breeze, and at a temperature of 3°C and humidity of 48%.

Throughout the spring and summer, the park had flourished more then other years. This summer, in particular, had much more rain compared to others and the humidity was, and still is, significantly higher as well. It has also begun a snow a couple time, earlier than when it usually snows in Calgary. Now during Autumn, after the second snow, the park is still green in some areas and quite decayed in others, in specific, the deciduous trees. There also seems to be the same amount of sunlight throughout the park, visible from the amount of snow that is left is similar in all areas. Lastly, I noticed that only two types of birds visit or stay in the park: Magpies and Crow. They would normally perch in particular tree, but will jump and walk along the grass and pathway below doing, what seems like looking for food. Squirrels are one of the only rodents in the park and behave in a similar fashion to the bird.

From my observations, these are the questions that came about:

  1. As the park is well maintained by the city, how will the trees change along with the season? And how will that affect the birds and mammals that live there?
  2. How does the humidity level, potentially due to increase rain and snow, affect the trees and greenery? It would also be interesting to see, due to snowfall and sunlight, how and if there will be changes in flora in the park?
  3. Where the birds (Magpies and Crows) and squirrels particular to certain trees in the park because of habitats made in those trees, and/or if there is a food source nearby, and what that source is?

Blog Post 1: Observations

The location I have chosen to observe over the period of this course is very close to home (literally). I live in rural Ontario on my family farm. The 100 acre farm is situated in the town of Kincardine. Historically, home to dairy, poultry and beef cattle, but now primarily functions for cash crops. The property is partially forested with tributary creeks from the Penetangore River in the northerly portion of the property (Figure 1).


Figure 1: Shelton Family Farm Property (Lot 20, Concession 5)

The primary focus of this project will be the pond in the south easterly portion of the property (Figure 2). This pond was man made approximately 30 years ago. It has an approximate perimeter of 94.32 meters and surface area of 527.82 m2 (Figure 3). The depth of the pond is about 6 meters. Although a smaller study area then what has been chosen by other students in this course it is thriving with biodiversity. The pond goes through many changes from season to season, and evidently has become increasingly vegetated and overgrown in the last 5 years. (To be discussed in a later post with comparative air photos and hypothesis).


Figure 2: 2015 Air Photo of the Shelton Pond


Figure 3: Approximate Pond Measurements

In my childhood, as well as my mom and her siblings’ kids have spent numerous hours catching frogs, tadpoles, toads, salamanders, fish, and observing various birds and snakes thrive in this ecosystem. A variety of animal tracks indicate that it is frequently visited by deer, coyotes and racoons as well. I am keen to take the time to identify these species. My initial questions for this research project are as follows,

1. How many varying species of plants can I identify? Are there any invasive species? Which species are more rare than others?
2. How will the upcoming weather changes (fall to winter) effect the vegetation and functionality of the pond ecosystem?
3. How have reduced water levels (compared to Spring and Summer) effected vegetation and species? (Figure 6).
4. Do any endangered or species at risk live in or utilize this ecosystem?

These observations and photos were taken October 6, 2019 at noon. The temperature was approximately 15 degrees celsius, partially cloudy and windy.


Figure 4: Side Profile of the Pond


Figure 5: Close Up View of Pond


Figure 6: Reduced Water Levels in Pond


Figure 7: Mammals den or did my dog dig this hole?