Blog Post 2: Sources of Scientific Information

a) The ecological source of information I have found is as follows: Kahn, AS, JWF Chu, and SP Leys. “Trophic Ecology of Glass Sponge Reefs in the Strait of Georgia, British Columbia.” Scientific Reports, vol. 8, no. 1, 2018, pp. 756-11. This source was found on the library website.

b) This article is a research, peer-reviewed, academic source

c) This article is a research article as it outlines a typical research article format (ie. Abstract, introduction, methods, results, discussion), has a descriptive title, the authors of the article (researchers) are associated with a university/institute (as seen by the citation besides their names) and it includes data from their findings. It is an academic source as it is published in an academic journal and including references to supporting research and has in-text citations. The article is peer reviewed as the revision and publication dates are noted.

Blog Post 1: Observations

Initial observations:

The area I have chosen to observe is a small forest area in North Saanich, B.C. There is a trail that connects two suburban roads and a covered forest area to the right of it. I visited the site on September 21. 2019 at approximately 12:10pm. The temperature outside was 16 degrees C with complete cloud cover and no sign of recent rain. The northern side (I believe I will double check coordinates on my next visit) of the trail begins off of a suburban road and the entrance is covered by trees but while walking opens up with the forest on one side and a small area of farm land on the other. The trail opens on the southern side at another suburban road. I noticed while walking that the soil and vegetation that grows changes greatly this is most likely due to the trees that cover the beginning of the trail. The vegetation on the north side of the trail was low to the ground and dense while the vegetation on the south side of the trail was more grass-like and drier with the ground and soil being dry as well.

When entering the forest area I noted a “wildlife tree” with a sign labelling it as such. This tree had a very different appearance to the trees around it. The bark had been worn away, it was much shorter, and it had small holes all over it (from birds and insects? unsure of what type). In the forest area I noted two black slugs (most likely Arion ater L.) and one yellow spotted slug (most likely Ariolimax columbianus). I also noticed that most of the forest floor was covered in a vine-like plant, as well as some going up a few of the tree trunks, covering some smaller tree stumps that had been either cut down or fallen over and completely covering two fallen trees. I was curious as to the plants preference for where it grows- if it has a preference for dead vs alive trees. A few mosquitos were also noted!

some initial questions from my visit are:

  1. why was the “wildlife tree” showing signs of animals/insect preference when no other trees around had similar markings? what caused this? also interesting to note this tree was at the very beginning of the trail and visible from the road side- why would animals have a preference for a tree closer to human habitats.
  2. How does branch cover affect the soil and the vegetation that grows there? how light exposure affects plant growth.
  3. The pattern of the growth of the vine vegetation was of interest to me and I am curious if the conditions to which the plant is growing affects it, is it getting nutrients from the decomposing trees? I will see if I can find roots without harming the vegetation.  

Blog Post 7: Theoretical Perspectives

Blog Post 7: Theoretical Perspectives


September 30, 2019


The theoretical perspective for my field research project came from the positioning of the Hydrocotyle plant. When I was observing the lawn landscape, it seemed as though the Hydrocotyle was only found in the Southern area. The region of the landscape closer to the North side was higher in soil elevation. When I further examined the grassland on the far Southside, I noticed it had a dip in the soil, a region of lower elevation. I presumed more water would collect in this lower elevation area, and the region of higher elevation would receive more sunlight, helping to dry it out. After looking at research and botany articles, I had discovered that this genus is typically known to be aquatic. My assumption was that the soil moisture in the landscape must be over a gradient, which is why the plant would be found in this area of the lawn but not in the far Northside. I decided to test the hypothesis that there was a moisture gradient in the lawn, by purchasing a “Moisture meter” from the garden center. I used the mosituer meter to determine that the area on the Southside of the landscape did indeed have a higher mositure content. The moisture found in this area was drastically higher than on the North side. I checked the moisture levels on 3 different days. On average the South area ranged from ‘10’ (farthest Southside) to ‘4’ (on the Northern side). The moisture levels varied on the 3 days which I observed them, but all showed the South side having a high moisture level of ‘10’. I decided to test the theory that Hydrocotyle was limited by the moisture.


My research project touches on the ecological process of plant limitations on soils moisture levels. As I observed 6 different species in the lawn, the project also touches on diversity of plants in areas of high soils moisture levels vs. low moisture levels. I found more varieties of plants in the areas of high moisture level. The paper would also include the ecological process of reproduction and plant growth under soil moisture. Three key words I would use for the research paper are “soil moisture,” “grassland gradient,” and “Hydrocotyle limitations.”


Post 4: Sampling Strategies

In the online sampling simulation, I chose to sample the Mohn Mill site using distance sampling. I found that systematic distance sampling had the fastest estimated sampling time with 4 hours and 7 minutes.

The percent error for species density of the two most common and two rarest species at the Mohn Mill site using distance systematic sampling is as follows:

red maple = |(392.4-403.7)/403.7|x100 = 2.799%

white oak = |(49.9-74.5)/74.5|x100 = 33.0%

yellow birch = |(0.0-0.8)/0.8|x100 = 100%

white ash = |(0.0-0.8)/0.8|x100 = 100%

The percent error for species density for the same species as above using distance random sampling is as follows:

red maple = |(380.8-403.7)/403.7|x100 = 5.673%

white oak = |(53.3-74.5)/74.5|x100 = 28.5%

yellow birch = |(7.6-0.8)/0.8|x100 = 850%

white ash = |(0.0-0.8)/0.8|x100 = 100%

The percent error for species density for the same species as above using distance haphazard sampling is as follows:

red maple = |(735.5-403.7)/403.7|x100 = 82.19%

white oak = |(157.6-74.5)/74.5|x100 = 112%

yellow birch = |(0.0-0.8)/0.8|x100 = 100%

white ash = |(0.0-0.8)/0.8|x100 = 100%

The more abundant the species, the more accurate the sampling. Conversely, the less abundant the species, the less accurate the sampling.

Systematic sampling appears to be the most accurate sampling method, followed by random sampling, and finally haphazard sampling.

Post 3: Ongoing Field Observations

I plan to study the Douglas Fir trees found at the junction of Johnny’s trail and Douglas Fir trail in Canmore, AB.

Notable locations along the environmental gradient of my location include: a flat, open forested area; a more densely forested area on a slope; and a rocky, sparsely vegetated spring run-off gully.

The first location has a variety of shrubbery, clover, and rose bushes; along with randomly dispersed Douglas fir trees in low abundance. The trees appear to grow as individuals. On average, there appears to be more Douglas fir saplings in comparison to older trees. All Douglas fir trees present appear to have branches evenly dispersed around the tree’s radius.

The second location has less of a variety of shrubbery, clover, and rose bushes. There are more densely dispersed Douglas fir trees in great abundance. The trees appear to grow in clumps. There appear to be more older trees than saplings.

The third location has very few plants. There are a few immature Douglas fir trees growing around the edges of the gully, along with a few shrubs. The Douglas fir trees grow alone and are nearly all older trees. The trees are widely dispersed and in low abundance.

My hypothesis I wish to test is as follows: do Douglas fir trees better resist cooling temperatures of changing seasons in groups or as individuals? I predict that the trees will fair better against the temperature change in groups.

A possible responding variable is the abundance, distribution, and size of the Douglas fir trees in each location. This variable is continuous. A possible predictor variable is the ambient air temperature and weather. This variable is also continuous.

Blog Post 6 Data Collection

My field data collection began when I revised my plots to include 2 separate plots of wet and dry soil. I created a field data table similar to the activity in Module 3. I set up the table to include the 6 replicates I have chosen; Hydrocotyle Heteromeria, Trifolium repens, Glechoma hederacea, Bellis perennis, Poa pratensis and Elymus repens.

My design is a Logistical Regression experiment as I am determining a categorical predictor variable. The predictor variable for the hypothesis is soil moisture. I have determined areas which contain high levels of soil moisture and areas of less soil moisture using a ‘soil moisture meter.’ According to Gotelli and Ellison (2004), am hoping to determine the “effects of X on Variable Y.” My experiment will help me determine if the effects of moisture variable ‘X’ limits the abundance of Hydrocotyle plant ‘Y’.

I have not had any trouble implementing the Logistical Regression sampling design, on the systematically placed transects. My data table has a categorical predictor of ‘absence or presence” of the replicates in each quadrate in the two sample plots. The only issue that I had not accounted for was the fact that it was so time consuming. Looking at 16 quadrates in two 5x5m sections to determine each species took me hours.


To decrease the chances that the experimental data results may not be a representation of the actual patterns occurring, I will have a large scale area to sample, greater than 1m2 (Gotelli 2004, Englund 2003).


I am performing a natural experiment in which the two plots are in natural settings and have not been manipulated. I am performing a snapshot survey of the plots (in the month of September) instead of a trajectory experiment which would be done over time and years (Gotelli 2004). Snapshots work well because the replicates are more likely to be independent of one another as compared to the trajectory experiments (Gotelli 2004).


I will be using 6 replicates which are the 6 most common species found in my lawn experiment. Using the “Rule of 10” I have systematically set up 4 transects in a North/South and East/West direction to give me 16 study plots in each of my 2 designated “high moisture content” and “low moisture content” areas. The quadrate size is 17x17cm, which will ensure that the samples are far enough apart to be independent. Both of the plots are homogeneous in climatic conditions. I don’t not need a control group as I am not manipulating the experiment, I am surveying the natural landscape.


Grain: Smallest unit of study = the absence or presence of the replicate in the 17x17cm quadrate

Extent: Total area encompassed by all sampling units = 2.7m2 of sampling area

Citation

Gotelli and Ellison. 2004. A primer of Ecological statistics. Chapter 6; Designing a Successful Field Study. Web. Accessed TRU.

Englund, G. and S.D. Cooper. 2003. Scale effects and extrapolation in ecological experiments. Advances in Ecological Research 33: 161-213. Accessed TRU.

Post 2: Sources of Scientific Information

The source of scientific information I chose comes from the TRU library. It is A conceptual framework for understanding the perspectives of the causes of the science-practice gap in ecology and conservation conducted by Diana Bertuol-Garcia, Carla Morsello, Charbel N. El-Hani, and Renata Pardini; all of who are considered experts in the field as they are employed by universities. This, along with in-text citations and a list of references confirms that the paper is academic. In the acknowledgement section, the author’s thank the two anonymous referees who reviewed the paper, making it peer-reviewed. The article includes methods and results sections making it a research paper. In all, the source is academic, peer-reviewed research material. The link for the source is below:

https://eds-b-ebscohost-com.ezproxy.tru.ca/eds/pdfviewer/pdfviewer?vid=9&sid=230560e1-28de-4db5-b67d-97d73a65bde9%40pdc-v-sessmgr02

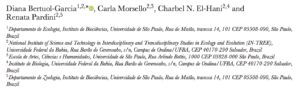
 This image demonstrates that the author’s are experts.

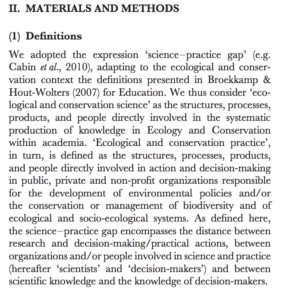
 This image demonstrates that there are in-text references and that the article contains a method’s section.

 This image demonstrates that there is a results section included. 
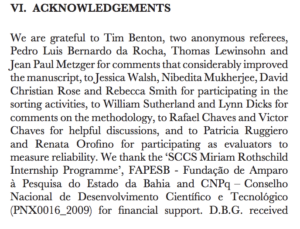
This image shows that two anonymous referees reviewed the paper.

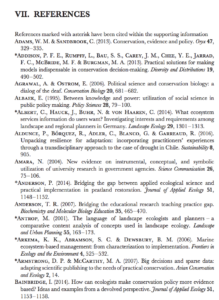
This image demonstrates that there was a list of references included.

Post 1: Observations

The location I have chosen to study is along the Douglas Fir Bench Trail in Canmore, AB at the foot of Mount Lady MacDonald. It is approximately 50m x 100m. It is next to a rocky, run-off gully; has a slight incline; and is within a douglas fir and birch forest. The forest floor is covered in shrubs such as juniper, bearberry, cinquefoil, clover, and Canadian Buffalo berries.

I visited this location on September 15, 2019 at 10:00 am. The weather was cool at 12 celsius and sunny with a few clouds. I noticed elk and deer scat throughout the area suggesting it is visited by such animals. There was what appeared to be a bird’s nest atop of one of the fir trees. Potential subjects of study for the area could be deer, elk, and douglas fir trees.

A few initial questions include: how do the douglas fir trees react to the cooling temperatures as the season changes; how do the shrubs react to the cooling temperatures as seasons change; and what attracts the deer and elk to the area?

Post 9

Moving forward, I would review some of the literature prior to designing another experiment.  As noted in an earlier post, if I had a deeper understanding of the evolutionary fitness of my response variable I would have chosen different replicates to study.  Although the results of my study were much subtler than what I had predicted, I have gained an appreciation for natural history and the importance of ecological theory before engaging in applied or industrial ecology.

Post 9: Field Research Reflections

Since the field experiment that I designed and based my research around was fairly straightforward and simple, I did not have many difficulties in carrying out data collection or analysis. I did not make any changes from my original design that I drafted back in April as the abundance of mature western redcedar trees in the research area did not change between the spring and late summer when my analysis and report were concluded. There are aspects of field work that I had never considered before completing this project, and it definitely allowed me to appreciate the meticulous record keeping that must be done when large experiments and observations are being conducted. The work that is done by ecologists to preserve mature stands of forest is incredibly important and this research has made me acknowledge just how much work and dedication the ecologists have put into the conservation of the natural world and our understanding of it.