Blog Post 4 – Sampling Strategies

Blog Post 4 – 03-02-20

Out of the three sampling techniques, Random Sampling was the most efficient in terms of time with the sampling taking a time of 12 hours and 4 minutes. Haphazard Sampling was the second most efficient technique in terms of time with the sampling taking 12 hours and 32 minutes and Systematic Sampling was the least efficient in terms of time with the sampling taking 12 hours and 44 minutes to complete. For the Eastern Hemlock Systematic data, the percent error for the density was 9.959% while for the Random data the percent error was 18.813% and for the Haphazard data the percent error was 6.895%. For the Sweet Birch Systematic data, the percent error for the density was 18.468% while for the Random data set, the percent error was 4.255% and for the Haphazard data the percent error was 24.085%. For the Yellow Birch Systematic data, the percent error for the density was 27.273% while for the Random data the percent error was 19.651% and for the Haphazard data the percent error was 31.129%.  For the Chestnut Oak Systematic data, the percent error for density was 9.456% while for the Random data the percent error was 23.771% and for the Haphazard data the percent error was 19.086%. For the Red Maple Systematic data, the percent error for density was 8.915% while for the Random data the percent error was 36.922% and for the Haphazard data the percent error was 19.176%. For the Striped Maple Systematic data, the percent error for density was 28.571% while for the Random data the percent error was 76.0% and for the Haphazard data the percent error was 114.285%. For the White Pine Systematic data, the percent error for density was 10.0% while for the Random data the percent error was 10.0% and for the Haphazard data the percent error was 50.0%. Based off of these calculated values, the most accurate sampling strategy for common species (the most common being the Eastern Hemlock) was Haphazard sampling, followed by Systematic sampling. In comparing the two most common species, Haphazard sampling an Systematic sampling were very close in terms of accuracy, while Random sampling was not close. Based off of the aforementioned calculated values, the most accurate sampling strategy for rare species (the most rare being the White Pine) was very clearly Systematic sampling. The accuracy generally declined for rare species, especially in the Haphazard sampling data. This suggested that as species abundance lowered, accuracy in density measurements also lowered. Having 24 sample points perhaps was not sufficient to measure the number of species in the area. Perhaps 24 sample points was enough to provide an accurate measure of the common trees species, but it was not enough to provide an accurate measure for the number of rare tree species in the area; however, 24 sample points appeared to be enough to capture the relative abundance of each of the tree species in the area. 

Blog Post 3 – Ongoing Field Observations

Blog Post 3 – 22-01-20

Upon examining the wooded area in the park closer on January 22nd at 1000 hours I have come to realize that selecting one biological attribute to study in the present winter conditions would be highly difficult considering the lack of vegetational growth. Therefore I have decided to study species diversity within Kinsmen park. The weather is at -6C and the sky is clear. Despite these warmer conditions, the area still appeared to lack any significant defining features. The biological attribute I have chosen to study is the density of White Birch (Betula papyrifera) compared to the density of Beaked Hazelnut (Coryluscornuta) in relation to location nearer or farther from the central pond.  After choosing these two subjects for comparison, I began looking at them across an environmental gradient on the northeastern side of the park where the vegetation was most dense. Five locations along this gradient were chosen, all approximately 15 feet apart

24-01-20

It is January 24th at 1200 hours. The skies are clear and the weather has warmed up a few degrees to -3C. There is a slight wind and it is very sunny outside. I examined the five locations along the gradient and noticed no observable changes in the trees and bush character. As trees are relatively slow growing, it is expected that there will be no changes in distribution or abundance for the tree species; however, changes in character for both species studied as the temperature continues to warm will be closely observed. 

26-01-20

It is January 26th at 1400 hours. The sky appears a bit overcast and the weather has dropped to -7C. There is no wind, but it is cold. In the White Birch area there are hare tracks and much of the snow on the trees has melted off. In other areas around the trees there appear to be much smaller tracks, perhaps those of a mouse. The hare and potential mouse tracks may suggest that as the temperature has warmed and snow has melted, the area is becoming more habitable for the animal life that is near the area. Surprisingly, I have noticed there to be more White Birch trees than I had originally estimated. They do not have any leaves, but their white and black, papery bark is easily distinguished even in the winter. The presence of the Beaked Hazelnut has been less prominent and leans further to the outermost edge of the gradient on the east side. 

29-01-20

It is January 29th at 1200 hours. The skies are clear and the weather is -2C. It is a relatively warm, sunny day. Along the gradient, the trees no longer have snow gathered on their branches. The same cannot be said for the bushes, which still hold snow in clumps at their base. Almost all of the vegetation in the park appears to be awaiting warmer temperatures to begin the regrowth process. I predict that White Birch will be seen in higher density closer to the pond while Beaked Hazelnut will be seen in higher density further away from the pond. I hypothesize that as the density of the White Birch increases, the density of the Beaked Hazelnut will decrease. I hypothesize this inverse relationship is due to the presence of moisture in the soil from the pond. One potential response variable from this is the density of trees versus shrubs measured in the number of trees or shrubs per square acre. This variable would be classified as categorical as the presence or absence of the two vegetation species are unique categories of measurement. One explanatory variable for these changes is the moisture content of the soil in the various locations of vegetation. This would be measured in g/m3 and is an example of a continuous variable as it can be measured on a continuous numerical scale. 


Field Journal – 1

Blog Post 2 – Sources of Scientific Information

Blog Post 2

  1. The ecological source that I have chosen is a scholarly article that details the benefits of plant biodiversity to various ecosystems.

https://besjournals.onlinelibrary.wiley.com/doi/epdf/10.1046/j.1365-2745.1998.00306.x

  1. The type of classification that this article would fall under is an academic peer-reviewed review article.
  1. This classification can be concluded as the author of the article, J.P. Grime, is of the Unit of Comparative Plant Ecology, Department of Animal and Plant Sciences, University of Sheffield, suggesting he is an expert on the subject of plant biodiversity and ecology, as explored in the article. Under the acknowledgement section in the article, the author thanks reviewers for their constructive commentary on earlier drafts of the paper, which suggests it was peer-reviewed. Also, under the acknowledgement section, the Natural Environment Research Council’s research was referenced as a source in part of the article, suggesting that the paper was a review and not a research article. Furthermore, there are no sections in the article discussing methods or results for research within the paper. All this information suggests that the classification for such an article is indeed an academic peer-reviewed article. 

Blog Post 1 – Observations

Blog Post 1 – 14-01-20

The area that I have selected to observe is a partially wooded park nearby a community in Strathmore, Alberta. The area features several different types of trees and shrubbery, some of which include Aspen Poplars (Populus tremulodies) and Beaked Hazelnut (Corylus comuta). The area is a green park and surrounds a central pond. There are four different docks bordering the pond that serve as fishing sites in the park. There is also a small playground on the eastern side of the park as well as a water park to the south. There is a central walking path around the park that provides views of the aforementioned locations as well as wildlife and vegetation. The park is about 0.05 acres in width and about 1 acre long and it is found about 53.0km east outside of the city of Calgary in Alberta, Canada. The park is mainly flat with some small hills and is densely packed in areas with shrubs, bushes, and trees. Towards the interior it slopes down to the central pond which is bordered by Broadleaf Cattail (Typha latfolia). The area I have chosen to observe has the formal designation of Kinsmen Park. I visited the site on January 14th at 1100 hours. The weather was -29C in the winter season in Canada. There was a mild wind and skies were clear. There were some very small tracks in the snow, about 2 inches in length, potentially those of a hare and they led into the trees on the north-eastern side of the park. Potential subjects I am interested in studying for this project include the Mus musculus (mouse), Lepus americanus (snowshoe hare), and Pica hudsonia (black-billed magpie). Some questions I am looking to consider for my research project are the following:

  1. How quickly do certain tree types respond to warming temperatures and weather conditions in Calgary? In what ways do they respond to warming temperatures?
  1. Does magpie presence increase in forested areas near human communities as temperature increases?
  1. How do certain animal species function under conditions of freezing temperatures?

Blog Post 9: Field Research Reflections

My research investigated the changes in vegetation and  percent species composition along a slope located in northern British Columbia. The results of my research supported my hypothesis in that the vegetation grew more complex at higher elevations, possibly due to varying amounts of light and differing microclimates. In terms of study design, I did have to change my quadrat sampling size from 1 m2 to 25 m2 to account for the increasing size of plants, however this could have introduced some bias so I converted all area measurements to a percentage in order to compare percent coverage of species between quadrat sizes. After reading the literature on my topic I definitely became more interested and in further courses may pursue more research in this area.

I did find designing a study challenging at first. I found it difficult to spot a pattern in nature and choose an element that I wanted to explore further. After choosing my phenomena of interest, the research design and data collection were fairly straight forward. I definitely gained a stronger appreciation for the development of ecological theory and for those who make a career out of it.

Blog Post 6: Data Collection

Over the past weeks I’ve visited the site a few more times and have indeed noticed additional ancillary patterns in regards to the presence of Alnus rubra. The remaining trees have a more clay-based soil still present around them and this suggests their survival is potentially related to the edaphic conditions of the soil that have not washed away yet. I have also recognized mistakes in my initial experimental design, and attempted data collection from a distance (as noted in one of my last posts) but it is not possible. It’s because of these factors that I need to adjust my hypothesis to reflect the new patterns i’ve noticed and I also need to alter my variables and sampling technique.

As the shoreline continues to rapidly erode at this location, the loss of soils capable of providing growing area for Alnus continues to disappear. The soil that continues to be washed away (mostly clay-based) appears to be the desired location for whatever Alnus rubra are present and potentially the desired location for their seed. These edaphic changes, combined with interspecific competition from plant species that are better adapted to the more sandy or gravelly soil mean that Alnus rubra will eventually no longer be able to survive and reproduce in this area.

If I believe that Alnus’ presence will decrease as soil type moves from clay to gravel, but may also depend on the plants that are most dominant in these zones as well, I can record data for these using two separate models and then analyze them to see if plant dominance does affect Alnus presence.

Response variable 1: Presence of Alnus rubra

Predictor variable: Soil type (stony/gravel zone, sandy/gravel zone, clay mix zone)

Response variable 2: Dominant plant type (based on plant with most % cover in each zone)

Predictor variable: Soil type (stony/gravel zone, sandy/gravel zone, clay mix zone)

Sample unit: 400-500 meter transect across the shore. The width is 6 meters, going up from the high tide line to the level top of the slope.

Subsample unit: Quadrats are randomly generated # of paced meters, continuing from one quadrat to the next. This area of study is difficult to access and is hard to record accurate data unless I use bigger quadrats than my last attempt. Each quadrat is a 2m (along shore) by 6m (up slope) rectangle. The presence of Alnus in each soil type as well as the dominant plant species in each soil type is recorded.

40 quadrats were randomly placed along the transect and data was recorded. A second round of data collection with a new set of random quadrats was completed on the same day, therefore I had one replicate.

I am expecting continued adjustments to my hypothesis and design as data is recorded and analyzed.

Blog Post 3: Ongoing Field Observations


Over the past two weeks, I have been walking my field site wondering about what organism or environment I want to study. I have made several observations within my field journal, noting a wide range of possibilities, and have decided upon the Himalayan Blackberry (Rubus armeniacus) (HBB). This an invasive species to Vancouver Island that is found along the Wetland ecotone.

Vancouver Island is just coming into spring, and new growth is starting to occur within the ecosystem, but not on the blackberry vines yet. The first area I chose to observe was a slope alongside the road that quickly transitions of short grasses. The second area is at an area where high rivers and flooding have caused parts of the bank to erode, washing away parts of the transitional area containing blackberry bushes. It will be interesting to see if the blackberries colonize around the obstruction, or if native flora will be able to become established. The third area is a zone that borders woodland and my ecotone. The HBB becomes pervasive, walking through the ecotone becoming less developed with the existence of mature Cedars and Douglas Firs.

My Hypothesis: Himalayan Blackberry (Rubus Armeniacus) prefers a ecotone environment.

There is a visible transition zone from forest to wetlands along the ecotone with invasive species (Scotch Broom and Himalayan Blackberry), seemingly winning the race. Blackberry bushes seem to prefer the ecotone environment with minimal bushes appearing in forested areas. The categorical response variables could include recording the amount IN m^2 of HBB I observe in a perpendicular direction spanning into the ecotone. Predictor variables could be the amount of sunlight reaching the vine going into denser brush. An experimental design could include a one-way layout, by choosing patches of blackberry and documenting their health going into spring. I will choose ten replicates at a minimum making sure that each choice is independent of one another.

Tables and Graphs

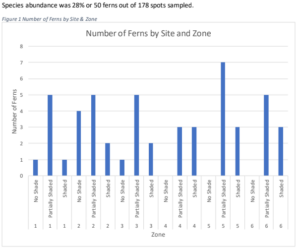
I collected data from 6 sites, Figure 1 shows the number of ferns per site; with each site being broken down into light gradients (no shade, partially shaded and shaded. From  my observations I anticipated that the shaded areas would have the most ferns. This was not confirmed since the partially shaded areas have more ferns.


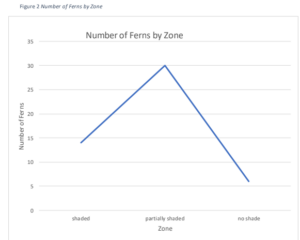
Figure 2 shows the light gradient going from shaded to no shade. The results show that the partially shaded have the most ferns. The areas with no shade had barely any ferns. There are several potential reasons that the ferns are almost not present in the non shaded areas. Two likely reasons are the ferns preference for wetter shadier areas and the other is that the sites are partially managed. Every several month or years in some sites the non shaded areas which do not have trees have the bushes and other plants cut. I think that after the disturbances ferns are not able to compete with early pioneers such as grasses and thorns.


Blog Post 7: Theoretical Perspectives

At this point in time I believe the pattern I have noticed and researched is the result of numerous ecological processes. The successful germination and/or survival of alder seedlings is not as easy and prolific as as I once thought. So far, according to my research, Alnus rubra’s ability to spread can vary significantly from region to region and from season to season. This is believed to be due to differences in how wet or dry the area is, availability of sunlight, availability of exposed soil, and competition. Even with this information, prediction of germination and survivability seems to be difficult to predict.

Focusing on my own site of interest, it may represent a shoreline that was once a good spot for alder to spread, but has changed significantly over the last 100 years. Here are a few ecological processes I believe my study may involve:

Erosion

I recently found some heritage photos dated to about the mid-1900s that feature the shoreline about 500 meters to the north. It’s clear that it the shore has receded many meters from where it once was and more trees were present along the shore in the past. I believe that a portion of my work may involve the subjects of disturbance and succession in that as the shoreline continues to erode the collapsed areas are quickly colonized by blackberry, ivy, and vigorous or invasive plants rather than alder.

Biotic factors

It’s also possible that this area experiences a high enough level of moisture that fungi or pathogens are present and quickly kill off any young seedlings that do germinate.

Availability of sunlight

I need to evaluate the potential ages of the trees in the forest area further to the east of the shore. It may be possible that the mature alders along the shore are actually older than the evergreen trees in this forest. If this is the case, the alders may have germinated at a time in which the forest was logged, therefore plenty of sunlight could reach the shore for most of the day. Now, years later, a forest of evergreens stands much higher than an alder could ever grow, blocking the sun until it makes its way far enough west to strike the shore in the late afternoon and evening only.

Keywords:

Interspecific competition

Biotic influences

Erosion disturbance (and succession)

Microclimate

Blog 7: Theoretical Perspectives

Blog Post 7: Theoretical Perspectives 

In considering the patterns and productivity of fauna that predominate on two separate gradients of differing exposure to ocean climate, the diversity of the vegetative species may reflect a relationship with their environment through analysis of the piece, the soil matrix. Each gradient undergoes the consistent disturbance of winter storms that bring strong winds, large waves and heavy rainfall. An inventory of the flora might give insight towards competitive success and preferred microclimates. 

My hypothesis addresses processes of ecological disturbance through sodium ion flux influenced by environmental dynamics. These abiotic factors have extenuating contributions from rainfall and average temperatures that are not of the main focus of this study, however, are under consideration in discussion. Competition and disease may also be contributing biotic factors that are not addressed in the hypothesis, yet may be of considerable association. Statistical data is being compiled to consider resulting deductions on community structure and complexity. The frequency of storm disturbance is thought to be of primary impact on the electroconductivity of the microclimates and soil matrix from which the diversity of vegetation is based. 

 E. Carmen Bell