Blog 6: Data Collection

Blog 6: Data Collection 

On January 21, 2020, the West coast of Vancouver Island was at the tail end of a typical winter storm. The morning had seen winds of up to 33km/hr and Environment Canada expectations were 20mm of rainfall. This is not unusual, however, it was not an ideal day for data collection. The sample unit was of soil matrixes of ten replicates. Each sample underwent three tests for total dissolved solids (TDS) taken to study the conductivity of the gradients in relation to the diversity of flora species. The ten soil samples were taken from surface to a depth of fifteen centimeters. Five samples were taken from the westernmost open ocean plot (41.1331°N, 125.8905°W) and five from the easternmost inlet plot (49.1207°N, 125.8969°W). The matrix of the soil samples may be more telling as to the biodiversity as is the electroconductivity, however, I think the data I collected will provide a reasonable clear expression of the patterns of vegetation. I will add the predominant storm patterns for this time of year to the introduction of my study and wonder if it should have been incorporated into the hypothesis. 

The following is similar to Blog #5 because I have accidentally combined the two posts.  

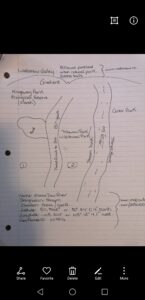
My hypothesis is testing soil conductivity and comparing vegetative species in quadrats placed using a systematic sampling method. I maintained random selection of sample replicates by tossing my spade towards a first sample site and then used a tape measure (predetermined distance) and a compass to sample the next four sites. For each sample site in the two gradients being compared, I placed the quadrat (0.5m x 0.5m) so that the spade was in the center and in a manner that allowed for the stems of the species of vegetation present, gently discouraging vegetation that was “leaning in”.  

The soil samples were taken from surface to a depth of fifteen centimeters. Five samples were taken from the western (open ocean) plot and five from the eastern (inlet exposure) plot. The matrix of the soil samples was as I expected, the open ocean samples being mostly sand and the inlet samples being mostly humus. At home I baked each sample in the oven at 200 degrees Celsius for four hours. I used a 1:2, soil to distilled water, to create a slurry, then followed the same procedure for testing the concentration of total dissolved solids for each of the ten samples.  

Because both regions being sampled had very little differentiation, there was no need to create subareas, therefore I did not use the stratified random sample method. Instead, I used a systematic sampling method to transect the sample region, the sample sites spaced in proportion to representation of the gradient, a method that if replicated would yield samples that were also indicative of the region. The data I have collected has demonstrated completely opposite results from the position of my hypothesis. In the name of science, I will not change anything but I will explore why this is so in the discussion portion of my study. 

E. Carmen Bell

Blog Post 2: Sources of Scientific Information

a) One of the sources that I am going to use is Petersons Field Guide to Western Birds


b) This peer-reviewed academic material, as Roger Peterson is a distinguished academic and an expert in his field.

  • The book includes in text citations.
  • Includes a bibliography (although in the introduction of the book instead of the appendix)
  • Peter Alden et al, reviewed the text

Has the characteristic of being written by an expert in the field- Roger Peterson is one of the world most celebrated naturalists. His first field guide as published at the age of 23 and has received more than two dozen honorary degrees, as well as the presidential medal of freedom.

Peterson, R., DiGiorgio, M., & Peterson, R. Peterson field guide to birds of Western North America. Boston: Houghton Mifflin Company.

Blog Five: Design reflections

Blog Five: Design Reflections by E. C. Bell 

My hypothesis-in-the-works has shifted towards considering the soil with the highest degree of salt to have the least amount of vegetative diversity. As a result, my sample unit has become the soil in relation to flora species and visible attributes. I maintained random selection of sample replicates by tossing my spade towards a first sample site and then used a tape measure (predetermined distance) and a compass to sample the next four sites. For each sample site in the two gradients being compared, I placed the quadrat (0.5m x 0.5m) so that the spade was in the center and in a manner that allowed for the stems of the species of vegetation present, gently discouraging vegetation that was “leaning in”.  

The soil samples were taken from surface to a depth of fifteen centimeters. Five samples were taken from the western (open ocean) plot and five from the eastern (inlet exposure) plot. The matrix of the soil samples was as I expected, the open ocean samples being mostly sand and the inlet samples being mostly humus. At home I baked each sample in the oven at 200 degrees Celsius for four hours. I used a 1:2, soil to distilled water, to create a slurry, then followed the same procedure for testing the concentration of total dissolved solids for each of the ten samples.  

Because both regions being sampled had very little differentiation, there was no need to create subareas, therefore I did not use the stratified random sample method. Instead, I used a systematic sampling method to transect the sample region, the sample sites spaced in proportion to representation of the gradient, a method that if replicated would yield samples that were also indicative of the region. The data I have collected has demonstrated completely opposite results from the position of my hypothesis. In the name of science, I will not change anything but I will explore why this is so in the discussion portion of my study.

Carmen Bell

Blog Post #1: Observations

The area chosen for study is called Point Defiance Park in Tacoma, Washington, US. The park sits on a peninsula that is surrounded by the Puget Sound: Dalco Passage on the east and the Narrows on the west, and it is about 760 acres. Point Defiance Park is mostly forested with tall fir trees, besides the zoo and aquarium that sits on its lands. The perimeter along the Puget Sound is comprised of steep hills or bluffs down to the water.

I observed Point Defiance Park at 11:45 on the 26th of January, at which time the tide was at 9.10ft/2.77m and going down.  At that time there was approximately 20 yards from the water’s edge to the incline of the hill.  It was 50 degrees (F) and mostly cloudy, though it has been raining consistently in the area for almost one month, very typical for this season, but warmer than usual.

There seemed to be many logs that had accumulated, (but didn’t look like driftwood) between the beach and the sidewalk that has been paved alongside it. On the other side of the sidewalk, trees grow very close to the water: it seems that deciduous trees grow right along the shoreline, and just beyond that and as altitude increases, the presence of coniferous trees increases, as well as the density of the forest.  The park seems mostly un-interfered with: I found many fallen trees as I went through the forest, and the further I got from the sidewalk, the trails of prior park visitors faded. Some of the fallen trees had mushrooms growing on them as well. On the ground below the deciduous trees were leaves mostly of two types, corresponding to two types of trees along the shore. They had not decomposed yet, and grass has started to grow through the layer of leaves. There were ferns all over, but none yet showing new growth. I heard many birds with the same call, but did not get a good enough look to identify them, as well as many glaucous gulls. I did not see but heard other park patrons report seeing great blue herons further down the beach.

Three questions I have:

  1. Does the diversity of birds increase as you go further away from high-traffic areas of the park?
  2. Is the pattern of deciduous trees close to the water and coniferous further from the water consistent around the peninsula?
  3. At times of low tide is there a greater presence of gulls or other birds?


Post 1: Observations

The area that I chose is a portion of the Millstone River, located in the East Wellington area of Nanaimo, Vancouver Island. This portion of the river cuts through a part of Nanaimo’s designated farmland. Several small scale vegetable and feed crops are along this subdued portion of the river, as well as housing developments. The areas around the Millstone river is cleared of the forest canopy, but small forested buffer zones do exist along the course of the river. Historical mining existed within the area in the early 1900s, and mine workings exist below portions of the landscape. It is unknown if these factors influenced the river through its history, but contamination of well water in East Wellington is of concern.

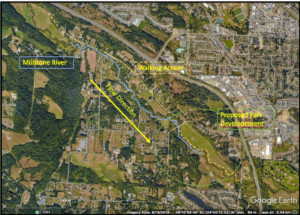
A proposal has gone through Nanaimo’s City Council to designate the area highlighted green in figure 1 as a Wetland Park.  Because of the reasonably shallow gradient of the landscape, the river tends to meander and create flooding within the park when the river is high, which attracts birds and other biota.

I visited the field site on January 26th at 2:30 PM. The landscape is almost clear of snow and we have received rainfall the past several days. Overall, Nanaimo has seen large amounts of precipitation this January, and the river levels are incredibly high.

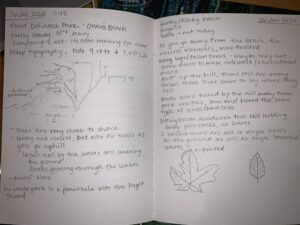
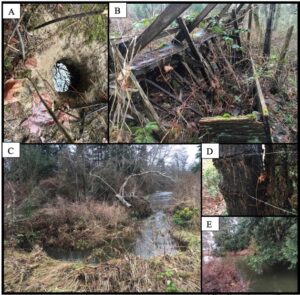
I accessed the river along the proposed park path and noticed that the large field in the park was partly flooded due to high river water. Walking down to the river, I saw that the river banks were nearly breaching, and large scale erosion was occurring along meanders (picture C). I could tell that at one point, agriculture had happened due to remnant barbed wire cutting through mature Douglas fir trees (picture D). Cow feed stalls in an advanced stage of decay were recognized, which could allude to the type of small scale farming that occurred. Invasive species that include English Holly, Himalayan Blackberry, and Scotch Broom are observed along the course of the river. Native species include numerous shrubs in hibernation, mature Douglas Firs, Maples, and alders. A possible beaver tunnel was the only signs of mammals at the site.

Some questions that I thought to myself as I was walking along the Millstone River included:

  1. How much has this landscape changed since humans began to influence it? 
  2. What positive effects will occur when the park expansion is completed, and could cyclical floods inhibit expansion?
  3. What does this unique niche bring to Nanaimo, and why is it worth protecting if the landscape is partly flooded for parts of the year?  

Post 6: Data Collection

I have collected 30 replicates divided evenly among three transects approximately 100 meters in length. The transects were selected using systemic sampling consisting of one for each direction; north, south, east, and west. The replicates were selected using random sampling by using a stop watch to randomly produce a number to determine how many steps to take to find my next replicate. Each replicate was evaluated for trunk diameter at chest height and aspect of growth. Collecting sample data has been difficult as of late due to inclement weather including deep snow and extreme cold. A pattern noted in my data is that Douglas fir trees found on an eastern aspect had the smallest average trunk circumference, followed by trees on a northern aspect, trees on a southern aspect, and trees on a western aspect with the greatest average trunk circumference. In the context of my hypothesis, this data has caused me to reflect on my prediction that trees growing on a northern aspect will have a larger average trunk circumference.

Blog Post 2: Sources of Scientific Information

The source I will examine is my field guide to wild North American mushrooms.

Miller O. K., & Miller H. H. (2006) A Falcon Guide: North American Mushrooms –  A Field Guide to Edible and Inedible Fungi. Kearney, NE: Morris Book Publishing LLC.

It is classified as “peer- reviewed academic review material.”

This is because

a) Dr. Orson K. Miller Jr. is an expert in the field

Dr. Orson Miller is a Professor Emeritus of Botany and Curator of Fungi from Virginia Tech, written 150 scientific papers, discovered and authored 1o5 new species and genera new to science, was president of the Mycology Society of America and has received many prestigious awards in the field (Miller & Miller,

b) in-text citations are present

c) a bibliography is present

d) the publication was reviewed by at least one referee, including Dr. Cathy Cripps, Dr. Walter Sundberg, Dr. Steve Stephenson and Marilyn Shaw

e) there is no field or lab study present, meaning this is review material

Blog Post #9 – Field Research Reflections

Going from set studies to do to a study that anything could be research was much more difficult that I expected it to be. I didn’t quite enjoy having almost no direction at the beginning, but it got easier and more clear the further along I went. There probably are changes that should have been made if I were to do this study again, but due to time constrictions, there wasn’t much movement I could do with it. But I did enjoy some parts, mostly going out to view nature, even if its a man made park, to simple watch it, as well as take my dogs out.

Blog Post 1: Observations

20-01-2020, 1300hrs-1600hrs.

Wakamow Valley, Moose Jaw, SK

Mid Winter, sunny day, -3degrees C

The area that I am going to study is Wakamow Valley in Moose Jaw, SK, my hometown. It is an urban park situated on Treaty 4 land, with 20kms of trails, and 500 acres of land (www.wakamow.ca). Within the valley runs the Moose Jaw River, at approximately 506m elevation (www.mapcarta.com/24501910). The area of Wakamow Valley that I will concentrate on includes Kingsway Park Ecological Reserve, Conor Park camping and recreation area, and Tatawaw Park (old Wild Animal Park) on the southern most edge of the park. There are four distinct ecological zones within just Kingsway Park: woodland, grassland, valley walls, and marsh. Conor Park and Tatawaw Park have been largely altered by tourism but both contain woodland, grassland and valley walls as well. At this time, it is mid-winter in the park, and I am finally able to do some research after a long haul of around -35 degrees C. There has been a mild amount of snowfall, and the park is easily accessible at this time.

Things I thought about on my hike through:

The road that cuts through the ecological zone and stream bed to access Tatawaw Park has been there for 80+ years. Some of the same marsh vegetation can be observed on both sides of the road but I wonder if there are distinct species that are present on only one side of the road now.

Do berries degrade differently naturally? Different colours of berry exist on the same branch but are both obviously rotten in the winter. Is this a normal differentiation or is it caused by disease/mold/etc.? Can it be observed everywhere in Wakamow or is it contained to the marsh area?

Does thorn length and distribution vary among berry bush populations based on location/sun/proximity to water/stream? Those closest to the river seemed to have significantly more thorns compared to those in marsh areas. Is it the exact same species or very similar but different species? Is it a product of age?

Distribution of berries: why is the marsh covered in berry bushes while stream-side it was hard to find any?

Distribution of mushrooms/fungus on trees: Majority of visible fungi found on trees east valley walls and marsh area while only two sightings on trees by stream bed. What affect does heat, shade, wind shelter have on distribution of fungi/mushrooms?


It is very difficult to find things to study in the dead of winter but will continue the search for something concrete to continue with.

Blog Post 5: Design Reflections

Did I have any difficulties implementing my sampling strategy? Yes!

  • I manufactured a simple 1mx1m frame from cardboard in order to accurately find my quadrats. I will say that a cardboard frame is not the best piece of equipment when its a rainy, gusty day at the beach…
  • The tide was all the way in when I visited the site, which made access to the lowest gradient quite difficult at times.
  • I found access to one of my gradients (the slope with boulders) to be more of a problem than I expected. It was physically difficult to reach the quadrats I was to sample in this area, and I had to resort to looking from a distance which was difficult at times due to the blackberry, snowberry, and other plant material in the same area.

Was the data I found surprising? Yes.

  • Yes, only in that I did actually find a single juvenile Alnus rubra when I expected to find none.

Do I need to modify my approach? Yes.

  • Once I put my sampling method in action it become clear to me that it’s not as accurate as I want or that it needs to be. I could not use the 1mx1m frame at every quadrat like I planned. I can’t use the frame for the accessible quadrats and then alter my strategy by eyeballing a 1mx1m quadrat for the inaccessible ones.
  • I need to review different sampling methods, particularly options of sampling from a distance.
  • Finding the single juvenile Alnus rubra brought more variables to mind such as; how exactly am I defining what a juvenile Alnus rubra is and do I need to factor in the harsh exposed conditions that may slow their growth so significantly that what looks juvenile is actually much older?, could the red alder I find be from seed washed up from somewhere else?, how can I 100% determine if alders near a mature specimen are not vegetative growth?

How will modifying my strategy improve the research?

  • Clearly identifying what a true individual alder with defined juvenile characteristics is will reduce the chance of misleading or recording false data.
  • If I can find another sampling strategy that I can do from a distance with a monocular (once the tide is out!)I can have access to more shoreline and therefore more sample plots and improve the accuracy of my data.