Blog Post #3 Ongoing Field Observations (Robyn Reudink)

I am keenly interested in birds, small mammals, plant vegetation and mushrooms, however the organism or biological attribute that I plan to study would be on the density and abundance of white spruce (Picea glauca).

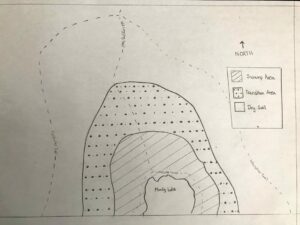
I went to Rundle Park, which is a municipal park, located at 2909 113 Ave NW, Edmonton, T5W 0P3, Alberta. I chose this park since it is quite bigger in area and has better sites to collect data and test my hypothesis. It’s total area is 0.82km^2 (0.32 sq. mi.) and elevation is 654m, with coordinates 53.563° N 113.392° W.

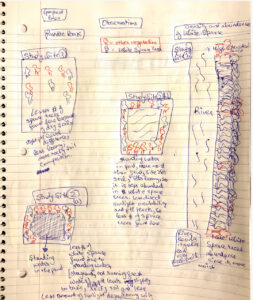
The three locations that I chose are:

Site 1: Forested area beside River

This location was right beside the river and I noticed that there were a lot of white spruce trees densely packed. The abundance and distribution was relatively high at this site. This was high elevated area with longer periods of direct sunlight available to them. The soil composition is ideal for the growth and abundance of spruce trees which was damp and moisty. It had lesser rocks when compared to other sites. The soil was loamy (sandy and clay).

Site 2: Near standing water (ponds area)

There were lots of little ponds in the Rundle park, with standing water. Some of the ponds had very clean water and some were not that much and had stagnant water. I noticed that the abundance and distribution was moderate at this site as there were fair amount of white spruce seen. Spruce found in this site were lesser in quantity compared to Site 1, probably because of the standing water ponds that were not that clean and fresh (stagnant). The soil was well moist, little rocky and not that loamy. There was less direct sunlight degree available. So observed few trees there.

Site 3: The park entrance area

The park entrance area did not have that many number of spruce trees comparative to the other location sites. One of the reasons I think is soil moisture and sunlight availability. The area was little dry and was rocky and less loamy in soil composition, so slighter number of spruces will grow.

My hypothesis is that the density and abundance of White Spruce is positively affected by soil moisture, light availability (shaded or direct sunlight), the degree of sunlight, pH levels of soil (little acidic) and soil type (sandy and clay soil) collectively.

My prediction is that the density and abundance of White Spruce is positively affected by soil moisture, light availability (shaded or direct sunlight), the degree of sunlight, pH levels of soil (little acidic) and soil type (sandy and clay soil) communally.

I might as well add how the soil depth level and specific soil pH level affects the growth of white spruce trees in my research paper including all study sites.

The potential response variable for my hypothesis is the abundance of white spruce trees. So, It is continuous.

The potential explanatory variable for my hypothesis is the soil composition, moisture and sunlight availability. It is continuous.


Blog post 3: Ongoing Field Observations

  1. Identify the organism or biological attribute that you plan to study.


The study I am conducting will focus on the abundance of Boxelder Maple tree species and the relationship between their increase in abundance as the distance towards the riverbank decreases.


  1. Use your field journal to document observations of your organism or biological attribute along an environmental gradient. Choose at least three locations along the gradient and observe and record any changes in the distribution, abundance, or character of your object of study.


Locations for study


  • Location one: “Riparian Area”

This are is located N/E using the parking lot as a reference point. It is a riparian area along the riverbank of the Red River with a sidewalk on the outskirts measured at 353.18 m. There is a very high abundance of Boxelder Maple trees beside the sidewalk and as I walked my way towards the river I noticed a few other tree species with low abundance such as Buroak and Arborvitae tree. Alongside the riverbank, there also seemed to be a high abundance of Boxelder Maple trees.


  • Location 2: “mini-forest”

I chose this area since it is the furthest area away from the Red River lake. I saw some White Spruce trees, a high abundance of Jack Pine trees, a low density of Boxelder Maple trees.


  • Location 3: “Forest next to River” but further away from the Riverbank when compared to location 1

As I walked from the off-leash dog area towards the direction of the river, there was a high abundance of White Spruce trees, some White Willow trees and as I got closer to the river there was an increased abundance of Boxelder Maple trees.


  1. Think about underlying processes that may cause any patterns that you have observed. Postulate one hypothesis and make one formal prediction based on that hypothesis. Your hypothesis may include the environmental gradient; however, if you come up with a hypothesis that you want to pursue within one part of the gradient or one site, that is acceptable as well.


Boxelder Maple trees dominate the area near the river. There are many reasons that can cause boxelder Maple trees to dominate the area near the river. One potential reason could be that it could be a natural area and since it is distant from other tree species such as Jack Pine trees it could have not been disturbed. In other areas of the park, Jack Pine trees dominate the area which could mean that it is an invasive species. Another potential reason could be their need for water. Boxelder Maple trees might require a higher amount of water in order to survive which is why they are found near the river and since trees have deep roots, they could be using the river as an additional source of water. The soil near the riverbank is the same level of dryness; therefore, soil moisture is not likely to be a potential reason for their abundance.


Hypothesis: Boxelder Maple trees is higher in abundance in areas near the river than areas further away from the river.


Prediction:

Boxelder Maple trees are more likely to be found in areas near the river than areas further away from the river.

Boxelder Maple trees require a higher concentration of water in order to survive.


  1. Based on your hypothesis and prediction, list one potential response variable and one potential explanatory variable and whether they would be categorical or continuous. Use the experimental design tutorial to help you with this.


Response Variable: Abundance of Boxelder Maple trees (Continuous measure).


Explanatory Variable: Distance from the Red River lake (Continuous measure).


Since both variables are continuous, this suggests that this study would require regression analysis for its experimental design.


Blog Post 3: Ongoing Field Observations (Robyn Reudink)

  1. Identify the organism or biological attribute that you plan to study.

The organism that I choose to study is the growth rates of Sunflower plants (sp. Helianthus annuus).

  1. Use your field journal to document observations of your organism or biological attribute along an environmental gradient. Choose at least three locations along the gradient and observe and record any changes in the distribution, abundance, or character of your object of study.

The potted sunflower plants are located on a concrete slab in an area that is approximately 20 m2. There are a total of 8 individual plant pots setup for this experiment – located adjacent to each other – with ~0.5m of space left between individual pots and setback ~2m from any adjacent vegetation and/ or structures. Note: there are 3 sunflower plants being grown in each of the 8 pots – for a total of 24 individual sunflower plants in this study – there are 12 sunflower plants in each of the 2 study groups (a low-water volume application group & a high-water volume application study group).

Refer to the attached diagram for an overview of the study area design which shows: the plant pot setup with sunflower plants nomenclature, and adjacent vegetation/ structure. Plants replicates L1 through L12 are all in the low-water volume group and plant replicates H1-H12 are all in the high-water volume group.

There have been no visual changes observed, to date, in the distribution, character or abundance of the potted sunflower plants. This is likely because the sunflower plants seeds were recently planted on May 26th and have not yet sprouted. However, there are slight differences between the plant pot locations within the study area, including – the physical location of each pot, and the vegetation and/ or structure that is located adjacent to each pot on the perimeter of the study area. My observations at the different locations within the study area, include:

  • Sunflowers plants L1-L3, & H1-H3 are all located in the SE section/ quadrat of the study area. These plants are located immediately adjacent to ornamental cedar bushes and an ornamental grass lawn on the south and east perimeters of the study area.
  • Sunflowers L4-L6, & H4-H6 are located in the SW study area quadrat of the study area. These plants are located immediately adjacent to ornamental pine and cedar bushes on the south and west perimeters of the study area.
  • Sunflower plants L7-L9, & H7-H9 are located in the NE study area. These plants are located immediately adjacent to an ornamental grass lawn and a house on the east and north perimeters of the study area.
  • Sunflowers L10-L12 & H10-12 are located in the NW study area quadrat. These plants are located immediately adjacent to a house and cedar bushes on the north and west perimeters of the study area.
  1. Think about underlying processes that may cause any patterns that you have observed. Postulate one hypothesis and make one formal prediction based on that hypothesis. Your hypothesis may include the environmental gradient; however, if you come up with a hypothesis that you want to pursue within one part of the gradient or one site, that is acceptable as well.

The underlining process that may cause patterns for this study is the 2 different water volume applications (low & high), these are the studies predictor variables. My hypothesis is that any observed changes in the size of the above ground portion of the sunflower plants are likely due to the water level applications. This is considered to be a manipulative experiment – as there are 2 predictor variables – while the other factors that could potentially influence the response variable are controlled therefore, this will allow me to reject or accept my hypothesis with a high degree of certainty. My prediction is that the size and density of the above ground portion of the sunflower plants will be significantly larger in the high-water volume study group, when compared to the low-water volume study group.

  1. Based on your hypothesis and prediction, list one potential response variable and one potential explanatory variable and whether they would be categorical or continuous. Use the experimental design tutorial to help you with this.

The potential response variable for this study are the size of the above ground portion of the sunflower plants (continuous). The potential explanatory variable are the amount of water received (low or high group) by each plant (categorical) in the study.

blog post 3- diagram


Post 3: Ongoing Field Observations

Date: 18 May 2021
Weather: Mostly Cloudy, no wind, no precipitation
Temperature: 12°C

I returned to my field study site and made my way to Mundy Lake. Mundy Park has lots of western Sword Ferns throughout the park yet near the lake there were very few. As I made my way away from the lake, I noticed the soil became drier and the number of Sword Ferns slowly increased. This environmental gradient sparked my curiosity and I decided that this area would be my location for my field study. I used Google Maps on my cellphone to mark GPS coordinates in order to map out this environmental gradient.

1. Identify the organism or biological attribute that you plan to study.

Western Sword Ferns.

2. Use your field journal to document observations of your organism or biological attribute along an environmental gradient. Choose at least three locations along the gradient and observe and record any changes in the distribution, abundance, or character of your object of study.
EnvironmentalGradient
Environmental Gradient

Near Mundy lake it is marshy, and the soil is consistently wet. This area had very few Western Sword Ferns. As I moved away from the lake the elevation increases slightly and the soil becomes more dry and solid. Along this gradient, the number of western sword ferns increased with increased distance from the lake. The greatest number of sword ferns were found in the dry soil and the lowest amount was found in the swamp area.

3. Think about underlying processes that may cause any patterns that you have observed. Postulate one hypothesis and make one formal prediction based on that hypothesis. Your hypothesis may include the environmental gradient; however, if you come up with a hypothesis that you want to pursue within one part of the gradient or one site, that is acceptable as well.

Process

The underlining process that may be behind this pattern is the amount of water in the soil. The soil I observed across this gradient included dry, muddy, as well as standing water.

Since sword ferns are preferentially located farther away from the lake, I hypothesize that soil moisture is a determining factor in the concentration of sword ferns in this area of Mundy Park.

 Hypothesis

Sword Fern density is greater in soil that relatively dry and solid rather than saturated mushy soil or standing water.

Predictions

Sword Ferns are more likely to develop in areas wherein areas that are not marshy.

Sword Ferns are more likely to develop farther away from the lake.

Sword Ferns are more likely to develop in nutrient-rich soil.

4. Based on your hypothesis and prediction, list one potential response variable and one potential explanatory variable and whether they would be categorical or continuous. Use the experimental design tutorial to help you with this.

Potential response variable: occurrence of Sword Ferns (Categorical).

Potential explanatory variable: Soil moisture defined as solid, spongy, standing water (Categorical).

This study would be tabular since both variables are categorical.

Blog Post 3 – Ongoing Dufferin Wetlands Observations

I returned to the Dufferin Park Wetlands on May 13, 2021 at approximately 16:40 hours, and decided to sketch a map (attached) to assist with further observations. I must note that the majority of the vegetation in this area is still in the process of recovering from the winter season.

On my way over to the wetlands, I noticed a “trough” that paralleled the sidewalk and tennis courts which featured some of the same vegetation that had I originally noted in my first blog post. I also made note of the two circular canal areas near the information/shade hut as they featured many similarities in vegetation to the wetlands, but to a greater degree than the “trough” noted earlier. Furthermore, during my observations, I noticed that only one bird attended the “trough” area and that two species of birds attended the circular canals.

These observations lead me to thinking that the diversity in wetland vegetation between these sites may have an affect on the diversity of bird species that interact with them. In short, I was lead to the following hypothesis and prediction:

  • A greater degree of biodiversity in wetland vegetation will lead to a greater degree of biodiversity in bird species that will interact with the vegetation.
  • I predict that more birds will attend areas that have more biodiverse vegetation more often than areas with less biodiversity.

The predictor variable in this case would be the number of plant species in a given area, and the response variable would be the number of birds that interact with the vegetation. I believe that the predictor variable will be continuous, but this may change as the vegetation develops over the spring and summer seasons. As such, this variable may change marginally (which remains to be seen) and may in fact become a categorical variable in time. The response variable in this case is categorical, so I believe that this will be either a logistic regression or tabular experiment.

I plan to use sections of the main wetlands area, the circular canals, and “trough” as there is a clear gradient in the biodiversity of plants between these areas.

Blog Post 3 – Ongoing Field Observations

Date: 8 May 2021
Weather: clear, no wind, no precipitation, 10% cloud cover
Temperature: 7°C

I returned to my proposed study area on 8 May 2021 at 0700. The first habitat type I travelled to was the forested area. Immediately I noticed more birds singing than the previous week. I looked at two different locations within the forested portion, and then travelled to the open portion of the study area. I left site at 0759.

Location 1: 10U 439505 / 5425195

This location is in the southwestern portion of the proposed study area. It is dominated by young coast Douglas-fir (Pseudotsuga menziesii var. menziesii) and has a moderate amount of understory consisting mostly of salal (Gaultheria shalon) and sword fern (Polystichum munitum). The canopy closure is approximately 65%. The following bird species were recorded at this location:

  • Townsend’s warbler (Setophaga townsendii)
  • Pacific wren
  • Red-breasted nuthatch (Sitta canadensis)
  • Brown creeper (Certhia americana)
  • Chestnut-backed chickadee
  • Pacific-sloped flycatcher (Empidonax difficilis)
  • Northern flicker (Colaptes auratus)

Location 2: 10U 439671 / 5425085

This location is in the southern portion of the proposed study area. It is similar in vegetation to Location 1, but it is on a steeper slope. The canopy closure is approximately 60%. The following bird species were recorded at this location:

  • Townsend’s warbler
  • American robin (Turdus migratorus)
  • Golden-crowned kinglet (Regulus satrapa)
  • Northern flicker
  • Pacific-sloped flycatcher

Location 3: 10U 439687 / 5425356

This location is in the northwestern portion of the proposed study area. Vegetation is dominated by scotch broom (Cytisus scoparius), with lesser amounts of salal and a few red alder (Alnus rubrus) and vine maple (Acer douglasii) saplings. Although birds were still singing, compared to the forest there appeared to be a lesser amount. The following bird species were recorded at this location:

  • Spotted towhee (Pipilo maculatus)
  • Song sparrow (Melospiza melodia)
  • Dark-eyed junco (Junco hyemalis)
  • White-crowned sparrow (Zonatrichia leucophrys)
  • American robin

My hypothesis is that songbird species richness and abundance is impacted by structural stage of habitat. I predict that songbird species richness and abundance will be higher in the forested portion of the study area rather than the open, shrub-dominated area.

Response variables will be songbird species richness and abundance. The explanatory variable will be structural stage. The response variable would be continuous, while the explanatory variable would be categorical as structural stage is based on a limited number of values.

Blog Post #3: Bracket fungi on trees

I took a couple month hiatus from field work to allow for the snow to melt and for the temperatures to get above freezing, in order to discover organisms I may not have otherwise encountered in winter. I set out on May 6 at 20:00 to the same park I had previously established as my field study site. On my walk I discovered a speckling of trees with bracket fungi (or polypores) growing near their bases. A rough guess would suggest that the prevalence of trees with polypores is about 1 in every 100 trees, including both deciduous and coniferous species. I am curious about what conditions foster the growth of these fungi and if any correlations can be made.


  1. Identify the organism or biological attribute that you plan to study.

Polypore fungi on deciduous and coniferous trees


  1. Use your field journal to document observations of your organism or biological attribute along an environmental gradient. Choose at least three locations along the gradient and observe and record any changes in the distribution, abundance, or character of your object of study.

I encountered five occurrences of trees with polypores.  All but one tree had polypores growing on the east side of their trunk. One tree had fungi growing on the northwest side. All but one were 50cm or less to the base of the trunk. One tree had growths that extended up to breast height. Each tree occurred near other trees (either deciduous or coniferous) that did not contain any fungi. However, the fungi-infected trees seemed to occur in isolation, in the sense that each one was spaced fairly far apart, at least 20 metres or more. None were clustered together from my initial site inspection. Three of the trees were poplar and two were black spruce. All had diameters at breast height (DBH) of at least 20cm.


  1. Think about underlying processes that may cause any patterns that you have observed. Postulate one hypothesis and make one formal prediction based on that hypothesis. Your hypothesis may include the environmental gradient; however, if you come up with a hypothesis that you want to pursue within one part of the gradient or one site, that is acceptable as well.

Process

From initial field inspection, it appeared that the bracket fungi predominantly produced flowering bodies on the east side of the tree trunk on larger trees that were enclosed within a fair amount of canopy cover. This makes me wonder if factors such as sunlight, wind, moisture, tree height and other physical factors affect where the flowering bodies appear.

Hypothesis

The distribution of bracket fungi is determined by tree location within the environmental gradient.

Predictions

  1. Bracket fungi are more likely to develop in well shaded densely populated areas.
  2. Bracket fungi grow on older and taller trees, on both deciduous and coniferous species
  3. Bracket fungi flower on the side of the tree that has reduced exposure to wind.


  1. Based on your hypothesis and prediction, list one potential response variable and one potential explanatory variable and whether they would be categorical or continuous. Use the experimental design tutorial to help you with this.

Potential response variable: occurrence of bracket fungi (Categorical)

Potential explanatory variable: degree of canopy cover (continuous)

This study would be logistic regression because the response variable (presence/absence of bracket fungi) is categorical while the explanatory or predictor variable (degree of canopy cover) is continuous.


Blog Post 3: Ongoing Field Observations

I returned to Edgewater Bar, located in Derby Reach Regional Park in Langley, BC (10 N 527496 5450356). As mentioned previously, the site includes walking trails, a dog park, a picnic area, and fishing along the Fraser River. I arrived to the site at 10:39 am on Sunday, May 2nd, 2021. The weather was a mix of sun and clouds, and the temperature was 13°C. The study area was approximately 400m2 and consisted of the Fraser River (Location 1), the meadow adjacent to the picnic area (Location 2), and the dog park (Location 3). My interest in birds drew my attention back to the American Robins (Turdus migratorius) previously seen foraging for earthworms. I began by observing if the Robins were present or absent in locations 1 through 3.

Location 1 – Fraser River: As I approached the river, I could see that the river level was significantly higher than the previous week. Grasses were growing amongst the rocks of the riverbank, which backed onto Western Sword Ferns (Polystichum munitum), Creeping Snowberries (Symphoricarpos mollis), and Himalayan Blackberry (Rubus armeniacus) as the ground changed from rock to soil. No Robins were observed foraging in location 1, likely due to the lack of suitable habitat for earthworms along the rocky riverbank.

Location 2 – Meadow: As I entered the picnic area, I observed two Robins foraging for earthworms in the meadow. The area consisting of grasses, flowering plants, and trees provided suitable habitat for earthworms due to increased soil moisture. People and their dogs could be seen walking along the trail approximately 15 meters from the foraging Robins. The Robins fledged either when they had enough worms, a loud group walked by, or when a dog entered the meadow. When the Robins had enough worms, they would retreat to the trees, likely where their nest was.

Location 3 – Dog Park: As I proceeded near the edge of the dog park, I observed two Robins foraging. A dog was seen playing fetch with its owner approximately 10 meters away. As the dog ran closer, the Robins fledged to a nearby tree. The Robins would return after the dog left. Shortly after, the gate opened with new dogs entering the park and the Robins fledged. Please note that dogs are only allowed to be off-leash within location 3.

I hypothesize that the length of time a Robin spends foraging in the meadow location will differ from the dog park location. I predict that the length of time a Robin spends foraging in the meadow location will be greater than in the dog park location. I predict this outcome due to the greater number of dogs present within the dog park than the meadow. The response variable for this study is the amount of time a Robin spends foraging at locations 2 or 3, which is continuous, and the explanatory variable for the study will be the presence or absence of dogs which is categorical.

Link to images: https://drive.google.com/drive/folders/1Tg35VPkbahNrzxLXt0PSwr3rMmArTGYU?usp=sharing

Blog Post 3: Ongoing Field Observations

I have decided to look at the effect of site moisture on the abundance of Hedera helix.

I am interested in studying the effect of invasive species on the abundance of native species but had a hard time finding an observable gradient between the two categories of plants. Upon observation of the ivy in the area, I began to notice a potential link between site moisture and proliferation of ivy. Since the presence of ivy can almost always be attributed to a reduction in native ground cover species, I decided to narrow down my observations to simply abundance of ivy. While I could have compared species all of the ground cover species in a given quadrat, including other invasives like Daphne laureola and Ilex aquafolium, H. helix is having a markedly more destructive effect on native species abundance.

I looked at three different moisture gradients, using tree species as a proxy for soil moisture in lieu of specialized equipment. I’ve classified the three different points on the gradient as zones:

Douglas-fir/ grand fir zone.
-characterized by heavy shade and mesic soil. The highest elevation of the three zones.

Arbutus/ Garry oak/ douglas-fir zone.

-Mesic-dry/ approaching xeric. Along the edge of the river, roughly 2m above the water level. I imagine the soil near the surface is quite dry, and the tree species composition is indicative of such.

Red alder zone.

-hydric/ probably seasonally mesic. Ground is visibly saturated and has been for many months. The only tree species that are able to grow here are red alder, with a few doug-fir on the margins where the soil moisture is starting to drop off.


I hypothesize that soil moisture levels affect the ability of H. helix to proliferate and out-compete native ground cover. I predict that abundance of H. helix will decrease with decreasing site moisture levels, and native species abundance will be higher on drier sites.

A response variable would be % ground cover ivy. This is a continuous variable.

An explanatory variable would be site moisture (determined by tree species composition). Since I have designated three “categories” by tree species composition, this variable is discrete.

Percy Herbert, Post 3: Ongoing Field Observations

For my research study I am deciding to focus on vegetative bud formation on wild rose plants. I have observed that taller rose plants appear to have long stems with no vegetative buds forming until the upper portion of the plant. The density of the vegetative buds at the upper regions of the plants appear to be consistent regardless of the height of the plant and how long the barren stem is below the buds.

More specifically, I will be measuring the distance from the tip of rose plants to the first, third, fifth, tenth, and lowest bud on the stem. I will take measurements from many individual plants, each of which will be measured to determine the height of the plants. I will take measurement from non-branched plants ranging from under 50 centimeters to over 2 meters. I will then try to determine if there any observable trends relating the distance from plant tip to vegetative buds to the height of the plant.

My hypothesis for this study is: For wild rose plants in Queen Elizabeth Park, there is an optimal distance from the tip of the plant to vegetative buds, regardless of plant height.

My prediction: Once rose plants reach a certain height the lower section of the stem remains bare. The density of vegetative buds will be the same in the upper regions of short and tall rose plants.

The response variable: distance from tip of plant to the first, third, fifth, tenth, and lowest vegetative bud on the stem. (continuous)

The predictor variable: height of the plant (continuous). In my study I will trying to prove that the height of the plant is not the most important factor in determining the location of the vegetative buds on rose plants.

A regression study would be appropriate for this study as both the response and predictor variables are continuous.