Blog Post 3: Ongoing Field Observations

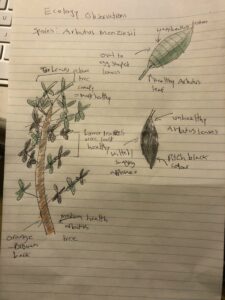
Organism being studied: Alnus rubra (Red alder)

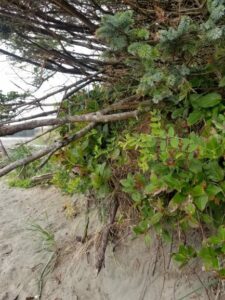
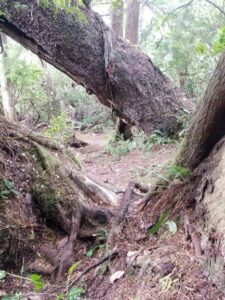
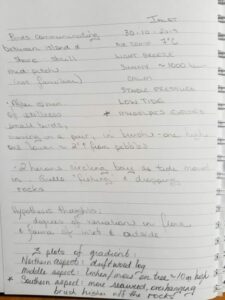
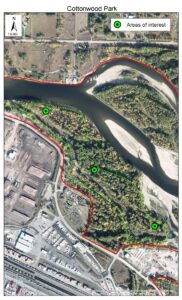
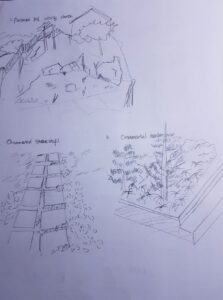
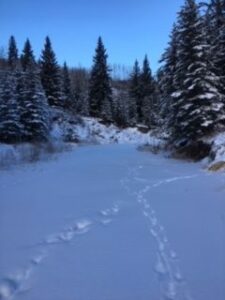
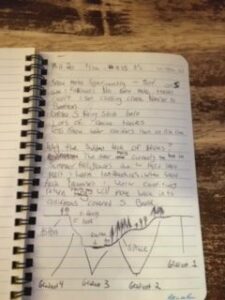
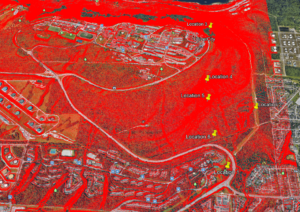
Gradient: The tree line of a forested ravine, the level top of of a slope before the shoreline, the shoreline itself which consists of boulders, small trees, mixed shrubs and perennials.

Alnus rubra is much more dominant along the shoreline and potentially non-existent along the tree line. This could be due to sunlight, a preference for more well-drained and less rich soil, or maybe Alnus rubra has a tolerance to the salt exposure (from the ocean) and has been able to outcompete other less tolerant species. It may also be that because its the only small tree species along the shore it’s much easier to spot than looking into a thick tree line.

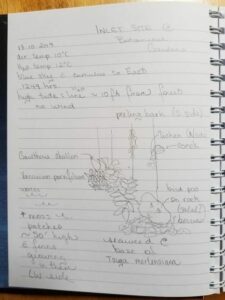
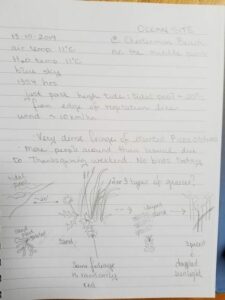
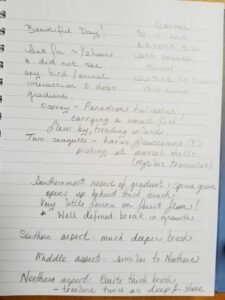
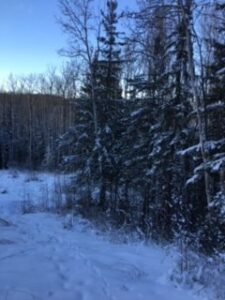
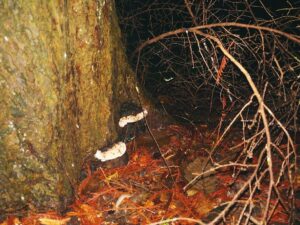
The trees almost seem to have formed a natural spacing between individuals as well with none closer than roughly 20 meters. These specimens all seem quite mature considering the harsh environments in which they grow (taller than 20 feet with stems more than 8” in diameter). Even though these trees are well-spaced and have an abundance of flowering and fruiting bodies, I could not observe any seedlings or juvenile specimens in any part of the gradient.

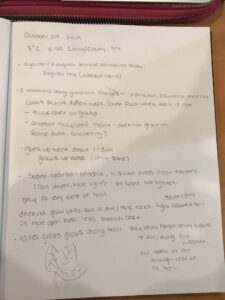
Hypothesis: The mature Alnus rubra in this region, despite an abundance of flowers and fruit, can no longer reproduce in this location via seed.

Formal prediction: The number of Alnus rubra seedlings and/or juvenile specimens recorded will be very low or non-existent along the shoreline and at the tree line. Due to a change in some environmental factor (or factors) mature specimens have survived but their seed cannot germinate or the seedlings cannot survive.

Potential response variable: Continuous. The number of immature Alnus rubra along the gradient.

Potential predictor variable #1: Continuous. The number of mature, seed-bearing Alnus rubra along the gradient.

Other potential predictor variables:

Categorical- Soil type along gradient (sandy, loam, clay, etc)

Continuous- pH and/or nutrient composition along gradient.

scan_p205726_2020-01-06-06-52-58

Blog Post 3: Ongoing Field Observations

The organism I am studying is the Arbutus species native to southern British Columbia and the Pacific Northwest in the USA: Arbutus Menziesii. The biological attribute I am examining is the health and colour of the foliage of the tree, as Arbutus trees in this area seem to be in varying health dependent on location (the environmental gradient).

I sampled 21 trees from 15 locations, and further divided these locations into 5 closely clustered regions as a way to measure how different environments effect the species and environmental gradient. The first grouping (1) contains 3 locations and 4 trees in a thick forested region. Group 2 contains 4 locations and 5 trees in a less dense forested region. Group 3 contains 3 locations and 3 trees in an even thinner forested region with some areas that appear open and free of large trees. Group 4 contains 2 locations and 2 trees in an area that is filled with sparse forest and more regions of cliffs and a lack of tall trees. The 5th group contains 3 locations and 9 trees. This area has the most open spaces, sparse vegetation and open cliffs.

In general Arbutus trees seemed to be smallest and with a larger proportion of unhealthy leaves in forested areas, and particular in areas where the surrounding area consisted of tall trees above the arbutus species.

The largest arbutus trees with the most healthy leaves were all in the least forested areas and particularly those growing on the cliffs.

The black leaves may be caused by a fungus or other microorganism, but I believe that trees that face environmental factors that hinder their ability to grow and stay healthy will be more susceptible to disease. In particular I believe that Arbutus trees have a very hard time growing and staying healthy in areas where they are overcrowded by the canopy of taller trees and competition for resources in the soil, hence why I have observed trees in poor health all in heavily forested areas with tall tree canopies, and very little ill health on cliffs and in sparsely patches of forest with smaller trees. Other factors such as access to water can be discounted as Arbutus trees are very hardy and can withstand long periods of drought. Additionally the unhealthy leaves persisted throughout the summer and the winter, which are periods where Denman Island experiences a dry season and then a wet season. 

Post 3 – Ongoing Field Observations

As I stated earlier, Cottonwood park is a place I go to very regularly to walk my dogs.  I have been having troubles pinning down an organism or an attribute that I can study, as it cold, there is 10-20cm of snow on the ground, and the majority of the plant species are dormant or hidden, and identification between branches can be difficult.

One thing I noticed were the rosa sp. species, as some still have their rose hips persisting through the cold.  It may be possible that there are actually two different species of rose,  Rosa acicularis (Prickly rose), and Rosa nutkana (Nootka rose).  I thought if I could differentiate between the two, I could study if one species had more rose hips persisting through winter than the other.  However, differentiating between these closely related species is difficult even when there are leaves and flowers, let alone when there are just decaying fruiting bodies.

Moving forward, I made some more field observations this morning (December 24).  I walked the loop on the east end of my study area from 6:00-7:00am.  The temperature was -7 degrees, with a wind chill of -15 degrees, and the sky was overcast.  It was still dark and everything is always very quite at this time.  It is rare that I see anyone.  However, this is the time of day where I usually see the local fox and hares.  Unfortunately, I did not see either this morning, but I did see a high amount of hare tracks, of all different sizes (Figure 1).  I see a surprising amount when walking in the morning, as my headlamp allows for attributes to stand out.

Figure 1: Hare tracks in the snow.

Though I find the animal aspects of the park very interesting, I think it would be troublesome to study as I will always have my dogs with me when I am at Cottonwood, which usually leads to most wildlife running away.

Next, I thought I would focus on the flora of the area.  Concentrating on the island portion of the park, I noticed that there were some areas that contained more coniferous tree species than others.  This area is predominantly Cottonwood (Populus balsamifera), with large veterans in the overstorey, and the multiple clones in the understorey, as well as many other riparian type woody shrubs and herbaceous plants (Figure 2).

Figure 2: Left, photo showing large veteran Cottonwood trees; Right, photo showing more coniferous trees.

With that said, I have decided to study the density of coniferous trees on different parts of Cottonwood island.  I am going to use three areas.  There is an inlet from Nechako river that makes a portion of this park an island.  I am going to use this as my gradient.  An area at the intake of the inlet, one in the middle, and one at the end of the inlet (Figure 3).  My initial observation is that there are more coniferous trees around the middle section of the island inlet.  I believe this is because the areas near the beginning and the end of the inlet are narrowing and closer to the Nechako and inlet water, increasing soil moisture , thus increasing the density of Cottonwood trees that are able to out-compete the coniferous species.  I believe there is a relationship between the density of understorey cottonwood and the density of coniferous species, and my hypothesis is, that in areas with less cottonwood regeneration, there will be more coniferous trees.

Figure 3: Locations at Cottonwood park island along the gradient.

The response variable in this study are the Coniferous trees and the predictor variable are the number of regenerating cottonwood stems.  Both my response variable and predictor variable are categorical as they will be classified  into presence/absence counts.

Blog Post 3 : Ongoing Field Observations

The organism that I decided to mainly observe were several types of grass which were mainly; long lawn grass, clover, short zoysia grass.

Three location I chose to make observation was; Preserved hill nearby the church, Ornamental stone steps in apartment complex, Ornamental garden in the apartment complex. Those three areas had been selected based on how the gradient of ornamental construction process. As it goes from preserved hill to ornamental garden land development gradient gets denser.

Observation of the area was based on three categories; how equally types of grass were distributed per area, how abundant each species were, and finally each characters of the species depending on the area. First in conserved hill, distribution of grasses were not even and species were barely observed, all I could observe was big rocks and dry trees and fell down leaves. Barely seen grasses were dry already, it just shown certain trees and that was all. Secondly in Ornamental stone steps, grasses were fairly distributed evenly but it was majorly covered with green healthy clovers rather than other types of grass. Although some short grass was observed they were dry already. Finally, in Ornamental garden the area was majorly covered with long lawn grass, they were all green and healthy, they were also distributed evenly along the trees and bushes and the species were majorly long lawn grass. It was hard to believe that these plants are growing in this cold whether.

After the observation, I assumed that as more artificial work was observed, the species were more abundant and fresh, compared to natural region. It might be because of the intention of it, ornamental function of the area. Due to this thought, I could come up with and hypothesis that, as more human induced changes occurs in land, the types of species are more abundant, and they grow more fresh compared to natural regions.

Potential responser variable that I could measure would be types of species observed per area and this variable is categorical. Potential explanatory variable is region that has got more range of intervention of land changes, this variable is continuous. And in this case potentially, logistic regression would be an ideal experimental design.

Blog Post 3: Ongoing Observations

In my study area at Fish Creek, I have noted frequent traffic by large mammals in the form of tracks in the snow. I have decided to study the patterns of travel used by the area’s large mammals. Specifically, I will be focusing on Odocoileus hemionusCanis latrans, and Vulpes vulpes. Though I have noted the presence of Alces alces tracks, I believe them to be too intermittent of visitors to the area to use as a focus species, though I will continue to note their presence. 

I will be using four gradients to observe the presence of these mammals. First, the top of southern slope of the Fish Creek gully. This is the open grassland of the golf course. So far, this gradient appears to have the heaviest traffic from Odocoileus hemionus. The second gradient is mid slope on the southern slope, approximately 70% Picea Glauca, 30% Populus Tremuloides, with a mostly closed canopy. This gradient also includes an open pipeline right of way. It is steep, about 70%-90% slope with level benches contouring the hill. Here, there is presence of tracks from Canis latrans, Vulpes vulpes, and Odocoileus hemionus.

Odocoileus hemionus tracks, Gradient 2

The tracks from the canine species seem to go cross slope as well as up and down slope, whereas the tracks from Odocoileus hemionus descend from the first gradient and then cut cross slope along apparently established paths. The third gradient is the gully bottom. This gradient is mostly open, though the steepness of the banks gives it an enclosed feeling. The watercourse of Fish Creek runs through the middle, frozen now, likely for the winter. It is often shaded, and on the level banks of the creek grows mostly grasses and a few shrubs, though these are now buried by snow. In this gradient there is presence of Canis latrans and Vulpes vulpes tracks, often following the frozen watercourse.

Canis latrans tracks, Gradient 3

The fourth gradient is the northern slope (south facing). This gradient is steep (>100%) and open with only the odd small Populus tremuloides present. Here I have noted a few Odocoileus hemionus tracks, though they are becoming less frequent as the snow continues to fall. 


These four gradients are a good representation of a common geographical feature here in the Peace River region of BC. There are many steep gullies with waterways at their bottoms and fields at the top. Where the waterways run West-East, they have both north and south facing slopes with very similar topography and vegetation to my study area. the three species I have selected to study are also very common in the Peace River region and, though the scope of my study in this course will be too narrow to cover it, I would expect to find similar behavior among these species in other areas in the region that are similar to my study area. 

Based on my observations, my hypothesis is that Odocoileus hemionusCanis latrans, and Vulpes vulpes will use the north facing slope most frequently for travel in the winter months. I predict that as snow continues to fall over the winter months, the open south facing slope, gully bottom, and the top of the southern (north facing) slope will house the deepest snowpack of the gradients, while the mostly covered southern mid slope gradient will have less snow accumulation on the ground. I believe this will lead to heavier traffic from large mammals, seeking easier travel routes. Based on the above, the response variable will be the abundance of Odocoileus hemionusCanis latrans, and Vulpes vulpes tracks present at any given gradient (categorical). The predictor variable will be snowpack depth at the different gradients (continuous). 

Odocoileus hemionus tracks, Gradient 1

Blog Post 3

I plan to study the fomitopsis pinicola mushroom.


Study Area with 6 locations and altitude overlay


I selected 6 locations to look for the mushroom along an altitudinal gradient on my two visits to the study area. Location One is 64 meters above sea level. In location One I was able to find the mushroom on a dead log and near the roots of a living tree. The first location is located in a wooded area near a small stream. The second location is at 128 meters and is up the power line trail, I was not able to find the mushroom. The Third location is at 195 meters and is on a trail with trees and shrubs on both sides just off the power line trail, I was not able to find the mushroom. Location Four is at 205 meters and location 6 is at 258 meters. In locations  Four and Five I was able to find the mushroom on two logs. Both location 4 and 5 are deep within the forest; however, they were right off a trail.  Location Six is at 96 meters. Location Six is near the trail end but still in the forest I was not able to find the mushroom.


Mushroom on tree
Mushroom on log

I think that the altitude of my study area does not affect the abundance of the mushroom. Based on this hypothesis I think that I can find the mushroom at any altitude of the study area. As this hypothesis is limited in that the Burnaby Mountain does not reach different Altitudinal Zones such as Subalpine I have created a second hypothesis. There is a positive relationship between the presence of dead logs in an area and the presence of the mushroom. Based on this hypothesis the more dead logs I find within an area the more I will find the mushroom.


The response variable is the presence of the mushroom. The explanatory variable is the dead logs the mushroom grows on. Both my response variable and my explanatory variable are categorical because the mushrooms are only found in very specific conditions such as on a living tree or dead log.

Blog Post 3: Ongoing Field Observations

I returned to the study site on September 28th, 2019 between 09:00 and 11:00. It was partly cloudy with light winds, and approximately 12 degrees Celsius. The biological attribute I plan to study is the relationship between tree species and the river. I would like to focus whether there is a correlation between the type and abundance of trees and shrubs, and the proximity of the river in regards to each species. 

Since my last visit to this area, many of the leaves have changed color and dead leaves are scattered along the trails and river. The river has not changed and continues to flow moderately. 

There are 3 different gradients along the site that I have observed:

Gradient 1: Closest proximity to the river bed (0-15 feet). This gradient consists primarily of large Red Alder trees, majority of them are leaning towards the river. Dispersed around the alder trees are Salmonberry shrubs. Moss is covering the approximately 60% of the rocks and lower parts of the trees.

Gradient 2: 15-30 feet from the riverbed. A thick row of fern can be seen as the gradient becomes elevated by 5 feet at approximately 15 feet from the river bed. Weaved within the ferns are very few Salmonberry. Further back into this gradient are a few Western Hemlock, Vine Maple, and Red Alder.

Gradient 3: 40-60 feet from the river bed, elevated about 15 feet. Various species of Maple, including Bigleaf and Vine Maple dominate this area. Need to research and return to the site to see if there are other types present, as it can be difficult to distinguish since there is a high density. Western Hemlock and Cedar are present in larger numbers and density than gradient 2.

A few things to consider about this site:

There is an overall elevation level of 15 feet, which could contribute to the change in vegetation, especially depending on how far the water table is underground. The forest is overall very dense, and majority of the light coming through is due to either fallen trees, or man-made trails that run through. The river is about 20 feet wide, and lets a considerable amount of light in. This could be another variable as to why the trees along the river bed are leaning inwards.  Majority of the moss in the area can be found close to the river, which could mean that moisture levels in the air are higher overall. 

My hypothesis:

The species of trees and shrubs that are closest to the river require more water and sunlight than trees further from the river.

Prediction:

My predictions are that Red Alder and Salmonberry require better access to water sunlight than the species present in gradients 1 and 2. Western Hemlock and Ferns are able to survive off less sunlight and a moderate amount of water. Maple trees require less water, but can grow tall enough to get adequate sunlight. 

Response Variable:

Tree and Shrub Species – Categorical

Explanatory Variable:

Proximity to the river – Continuous


Post 3: Ongoing Field Observations

The organisms I intend to study are predominantly people and domestic dogs. I’ve set myself up alongside a paved walking path next to the lake. I’ve been measuring weather conditions, including rain volume, temperature, pressure, light, humidity, and subjective observations (example: sunny, overcast, rainy, etc). I’ve given a consistent 15 minute period each day where I count the numbers of birds, people, pets, and any other animals that pass through or into the area during that period.

During my period of establishing the best means to complete this study, I attempted several locations as well as times of the day. For location, I attempted a spot near the playground, a spot along the walking path, and a spot near a floating bridge. Ultimately, from these spots I opted to stay in the spot along the walking path as I overheard a couple discussing how they didn’t like going over the bridge during the rain as it made their dog slip due to the texture of the wood when wet and I found that a lot of children near the park were very interested in discussing what I was doing with all of my weather measuring tools which I worried would make some of their parents apprehensive about frequenting the park.
The other gradient I explored was time period. I wanted to be consistent about the time I visited each day to avoid variability. I explored 07:00-07:15; 14:30-14:45; and 17:30-17:45. I ultimately opted for the 17:30-17:45 period as I personally did not want to wake up early enough to attend the 07:00 time slot, and work would prevent me from attending the 14:30 time period outside of weekends. Whilst attempting a few of these time slots, I noticed the variation not only in the number of people who came through my field area, but also the percentage of those who were walking dogs. The morning time seemed to be predominantly dog walkers and joggers (many of whom were with dogs also). The afternoon had almost no dog at all, but many seniors who were strolling through the park. The evening had a mix of both. This led to my official hypothesis and prediction.
I believe that more people will visit the park during periods of dry weather than during periods of inclement weather; but also that those who visit during the periods of inclement weather will be a higher percentage of those accompanying dogs than those without dogs when compared to the percentages during the drier/warmer days.
My predictor variable will be the weather conditions and my response variable will be the number of people and pets travelling through the park. These variables are continuous, not categorical.

Blog Post Three: Ongoing Observations by E. C. Bell


Blog Post Three: Ongoing Observations by E. C. Bell

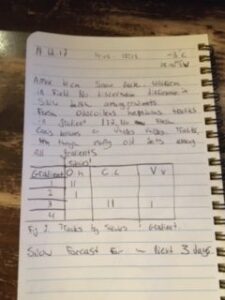
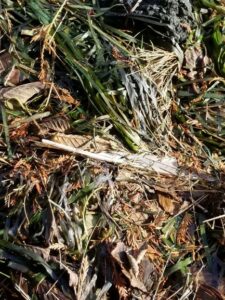
Feather embedded in seaweed, grasses & leaves at Inlet site.

The biological attribute of interest of my study stems from the comparison of two gradients approximately 5km apart which have differences in physical traits of the transitions from forest to shoreline affected by environmental factors, including weather patterns and soil structure. The two gradients lie across Esowista Peninsula from each other, the Eastern inlet site and the Western coastal site. The ‘piece’ in this comparison will be the variance in ecotone transition and the ‘pattern’ will be the similarities in species with distinct differences in their physical traits and interactions. The elevation of the inlet location has a more gradual slope directly through the shifts in environmental factors. There are pebbles that increase in size to boulders of beach-ball size at the forest line, more of both seaweeds than grasses towards the pebbles, holding feathers, shells and bits of driftwood. The coastal site rises steeply for approximately 1m from sand to brush, covered in grasses, some seaweeds, yet then tapers off to a gradual slope covered in thick brush, mostly Gaultheria shallon. There is a fairly distinct line where stunted Pinus contorta takes over, looking very bonsai in shape of the needles with a sparse undergrowth – very little fauna of any species was growing on the forest floor. It was a messy situation getting through the thick brush.

Western Coastal site                      Eastern Inlet site behind the shoreline brush

The hypothesis I am considering for this comparison of two environmental gradients is: there will be degrees of variation in the expression of populations and their densities within existing species due to tidal patterns and differences in weather exposure experienced over time. The ensuing prediction is: because of the different micro climates created by topographical land mass and Eastern facing aspect, the inlet site will have more biological diversity but less density in flora and interacting fauna than the Western facing aspect due to the open ocean exposure and pattern of winter storms, which have both shaped the gradients and variance that there exist. One categorical response variable may be variance in the dimensions of leaf size in Gaultheria shallon assuming that each location receives a similar exposure to sunlight. One continuous explanatory variable may be exposure to wind over a range of temperatures.


E. Carmen Bell

Blog Post 3: Ongoing Field Observations

The organism I plan on observing is English ivy (Hedera helix)

Since observing this vine-like plant last time I visited my study site, I researched the name of it and see that it is an invasive species in southwestern B.C.

When observing my study site, there is not a gradient of elevation, but there is a gradient of sunlight. There is a densely forested area that has lots of branch cover and little sunlight. Here the Ivy grows thick and covers stumps, fallen trees and the ground where the trail is not. Moving closer to the beginning of the trailhead, there is less branch cover and the ground is slightly drier. There are small patches of the Ivy, but the leaves are much smaller, and they grow in groups. Along the length of the open trail, there is no trail cover and the ground is much drier. Long grasses grow here, and there was no sign of the Ivy. It appears that sunlight is the underlying process for where the Ivy grows. Perhaps the plant is not so picky about where it grows/what species it is growing around but is more dependant on sunlight. This leads me to hypothesize that the English Ivy grows in shaded, damper areas.

The response variable here could potentially be the abundance of English Ivy growing (continuous) and the explanatory variable could be access to sunlight (categorical).