Blog Post 7: Theoretical Perspectives

My research project is on the frequency of western sword ferns in Mundy across three district zones (uplands,  transition, and swamp area) as a result of soil moisture. My hypothesis is that the frequency of western sword ferns in Mundy Park is significantly different in the uplands, upland transition, and swamp area due to changes in soil moisture. The ecological process behind my research is biological fitness as it relates to the survival and reproduction of ferns in different environmental conditions as well as zonation. Some underlying factors that may also be at play in this project include soil acidity, soil nutrition, and competition.

Three keywords that describe my research project: soil moisture, western sword fern, wetlands.

Blog Post 6: Data Collection

The collection of data was relatively straightforward. I used the same technique that was used in the collection of my preliminary data therefore I had already tested this sampling method. Unlike the preliminary data, for this data collection, I also collected data on the soil moisture. The soil-moisture meter was somewhat challenging as there were lots of areas where there were numerous rocks and roots in the soil which made inserting the moisture probe difficult. I had also did not anticipate for any bears to be in the area and a very close encounter with a black bear, which was an intense experience. I did 14 replicates of my sample in each of the three sampling areas and I did not notice any ancillary patterns while collecting the data.

Blog Post 9: Field Research Reflections

The field project aspect of this course certainly opened my eyes to the difficulties and complexities in both designing and undertaking an ecological study. As I have a very limited background in carrying out field studies, I did find the broad and self-directed nature of this project difficult, especially in terms of selecting a project I could carry out myself appropriately. There were certainly a lot of adjustments that had to be made in terms of my sampling design and variables to assess. 

My sampling of multiple quadrats within multiple transects was definitely time-consuming, and I also feel I chose a project with too many confounding variables which created an added difficulty and stress when putting my project and data together. Luckily I was able to find a fair amount of relevant research that aided in describing the results of my study.

Although this has been by far my weakest course thus far in my degree, I have certainly gained valuable skills in critically assessing scientific articles, and more importantly, gained a valuable appreciation and understanding for the amount of work involved in creating a scientifically sound and unbiased field study. Lastly, it was a great change of pace to have a fully hands-on aspect to an online course, which enabled a practical application of the theory being taught.

Blog Post 8: Tables and Graphs

My study hypothesis was that the Broadleaf Stonecrop abundance is determined by substrate drainability (i.e most abundant in sites with either a high rate of water percolation or surface runoff). To demonstrate the results of my study, I plotted three graphs; one showing the relationship between substrate type and stonecrop abundance, one showing the relationship between degree of slope and stonecrop abundance, and a third showing the level of drainability and stonecrop abundance. 

The first two graphs depicted strong relationships between stonecrop abundance and both substrate type and degree of slope individually.

The most difficult part was assessing the level of drainability within each quadrat as it combines the effects of two variables, slope and substrate type. A high degree of slope is going to increase surface water runoff, while a coarser grained substrate is going to increase the rate of percolation, both of which lead to a higher rate of water being drained from the area.

My graphs generally agreed with my hypothesis and demonstrated that the abundance of Broadleaf Stonecrop responds positively as water is drained faster from the substrate. My results also demonstrated that there are other confounding factors, as to be expected, that are also determining the abundance of my study subject. I had established four levels of substrate drainability, and predicted that the well and rapid draining sites would have the highest abundance of stonecrop, however my results indicated that the well draining sites in fact did not have the predicted response. It was later suspected that this is due to another factor, proximity to the ocean, as the majority of the well-draining quadrats were found to be facing the lagoon, as opposed to open ocean.

Blog Post 9: Field Research Reflections

Creating an ecological study, collecting data, and turning the data into a scientific paper is a daunting task. Luckily the course was designed in a way that helps guide you along all of the necessary steps. In order to keep my research project fully objective I wanted to find a study subject with predictor and response variables that were clear and easy to measure. I chose to observe the internode length in wild roses (Rosa acicularis).

During initial data collection measurements of internode length were easily obtained as the stems were vertical and non-branched and the buds were small, yet clearly visible. Unfortunately by the time it was time for the major data collection, the buds had sprouted and had developed into small branches and leaves. This made measurement of internode length much more difficult as it was hard to place the tape measure in a position in which it ran parallel to the main stem and it was hard to see the measurements as the branches would obstruct the view of the tape measure. Although data collection was harder than anticipated, it was still possible to obtain all of the measurements necessary for this study.

Engaging in this study has revealed to me the amount of work required to derive even the most basic of ecological conclusions. The results of my study suggest that Rosa acicularis plants at the Queen Elizabeth Disc Golf Course in Vancouver, BC have optimized internode length and that the internode length is not significantly related to the height of the plant. In order to use this information for further research time consuming data collection would be required. To observe the impact of various environmental pressures on internode length in R. acicularis, plants growing in many different environments with varying levels of environmental pressures would be required.

The choice of sampling unit and how to randomize sampling was a foreign subject to me before this course. I have learned that is of upmost importance to select samples in an appropriate manor so that extrapolations can accurately represent the population as a whole. The exercise of conducting a research project has given me insight into how scientists derive ecological conclusions and has made interpretation of journal articles much as easier.

Post 7: Theoretical Perspectives

For my initial observations, I explored a section of intertidal zone (ITZ) on a beach at the north of Vancouver’s West Side. Oysters did not seem to be evenly distributed on the intertidal zone, and at I observed that they were more prevalent near rocks. The ITZ is subject to wave action from tides, weather, and frequent boat activity moving through this busy stretch of water. Rocks are able to act as breakwaters to absorb some of the kinetic energy of the water movement. (Dodaran and Park 2019) Oysters are fairly hardy, but they are still susceptible to the stresses of hydrodynamic force. (Wall et al 2005, Theuerkauf et al 2017) Relevant ecological processes that my study touches on are interactions between abiotic and biotic factors (water movement and oyster resilience) and ecological stressors (tidal action, wave energy).

From this theoretical basis, I hypothesized that oysters in the intertidal zone receive protection from rocks, which interrupt wave action and therefore reduce the force of water movement. To test this hypothesis, I observed oysters in the ITZ at four different sites between Kitsilano and Jericho beaches. For each oyster, I recorded whether it was behind or to the left or right of a rock (within a “shadow” the length of the rock’s height), or if it was not in any rock shadow (either because it was not near a rock or if it was in front of or on the front or top faces of the rock).

Key words: oysters, hydrodynamics, intertidal zones


Blog Post 5: Design Reflections

For the collection of my initial data, I used stratified random sampling to sample the number of Western sword ferns in the marsh area, upland transition areas and the upland area. My hypothesis is that Western sword ferns prefer the upland area compared to the marsh and upland transition as a result of drier soil.  The difficulties I encountered were that I didn’t realize how dense some of the areas of the forest were, with lots of bushes and shrubs. I had to really bushwhack and force my way to some of the locations which were very challenging.  The data I did collect was in line with my hypothesis so it was not that surprising. Although my sampling technique was very challenging I plan to keep using this technique since I feel it will yield more precise results although I do plan to increase the size of my sampling unit as a felt 1meter squared was too small for this study.

Blog Post 2: Sources of Scientific Information

For this post, I have selected an ecological article titled “Warming and shifting phenology accelerate an invasive plant life cycle”. I found this article online in the journal Ecology, accessed through the UNBC library and available through Open Access. The link is:  https://doi-org.prxy.lib.unbc.ca/10.1002/ecy.3219.

This article is classified as academic, peer-reviewed research material. The source shows that both authors Keller and Shea are affiliated with Pennsylvania State University, multiple in-text citations are used, and a bibliography is available at the end of the document. Therefore, it is an academic article. In the acknowledgements section of the article, three people are thanked for their feedback on the article. Therefore, I conclude that it was peer-reviewed. Finally, there is a methods section which describes a field study in the article. So, I can conclude that it is a research article. The article is linked as documentation supporting my classification.

Blog Post 1: Observations

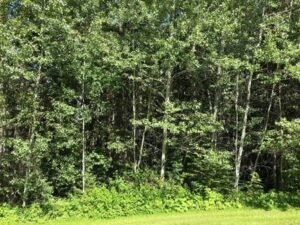
The location that I have selected for study is a forested section of land immediately next to my house. It is a section of Crown land located between the highway and a side road in the Cariboo region.

It is approximately 0.2ha of rolling topography which has depressional areas. I have visited this site recently during the months of May and June, under varying weather conditions of rain and sunshine during the spring months. Today it is about 20 degrees with sunshine.

There are many subjects for potential study using this location. I have the following questions which could form the subject of a research study:

  1. How does canopy closure or lack of canopy closure influence species biodiversity in the area?
  2. Is this area being used by large mammals? If not, are there ways to encourage its use?
  3. Are there invasive plants at the site? How are they affecting the biodiversity and health of the site?
  4. How does the biodiversity differ between a site which is located close to our well and one located farther away?

Images:

Overview of the Forested Lot
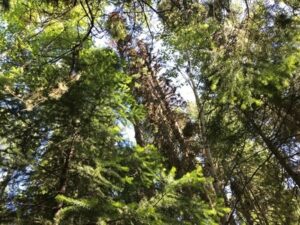
Dead Standing Timber in Lot
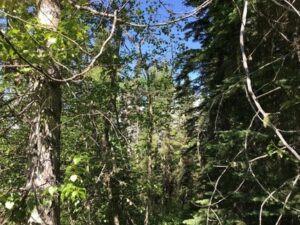
Interior of the Forested Lot showing Canopy Gaps
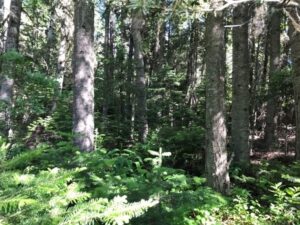
Characteristic Understorey Vegetation


Post 9: Field Research Reflections

This course and its field research project were novel, difficult, eye-opening, and mind-expanding. Having never taken an online university course before, the experience was new to me. Having been out of school (college) for >10years and launching into a 3rd year science course, I found the workload and expectations difficult – attributes I am grateful for, because it makes me feel that I have earned the credits. The course and project were eye-opening, because I got to see the sheer amount of work that scientists put into the field-components of their research. And the concepts – especially those of predictor and response variables and how they tie into the experimental/statistical designs – blew my mind.

In terms of the field-research component of this course, I’d like to expand on the eye-opening comment I just made. First of all I spent countless hours looking for patterns in the winter ecosystems around my home and the forests that I work in. Each pattern I found was not suitable for experimental analysis. I had to start over at one point when the instructor pointed out to me that my initial plan (assessing aspen ramet attributes [density, height, girth] as a response to distance from an abandoned beaver lodge) was fraught with sampling vs replication errors and bias, to which I am grateful for the reality check. During this time I read about experimental design for sampling vegetation, and I used this information to design the experiment I finally landed on, which seemed to work for me (though I likely would have chosen a different setup had I taken the time to read the literature at this point in the course).

I spent days creating quadrats out of wood as well as tent-like wooden structures to carry out my experiment of testing springtail snow-surface density (response variable) to covered and uncovered environments (predictor variable). Then I spent 5 days counting springtails at three specific times each day. The data set that I generated was time-consuming to analyze and I felt lost in the world of excel and the utter mystery of statistics, and the results were a tiny bar graph! Comparing this to the amount of data-gathering and intricate designs outlined in some of the papers we had to read for this course, I see how scientific research can be so all-consuming and difficult to perform. Hats off to scientists!

By the time my data was collected and my literature review began, I started to realize that my project could/should have been so much more. I should have done more replicates. I should have sampled in different habitats such as forests, wetlands, and wildfire-burnt openings. I should have measured temperature above the surface instead of on the surface. I should have identified each and every springtail individual to the species level. I should have factored in other weather-related variables as predictors such as cloud cover and barometric pressure. The list could go on.

All in all, the reality of studying ecology – its wonders, difficulties and intricacies – very much hit home thanks in large part to this field research project.