Post 5: Design Reflections

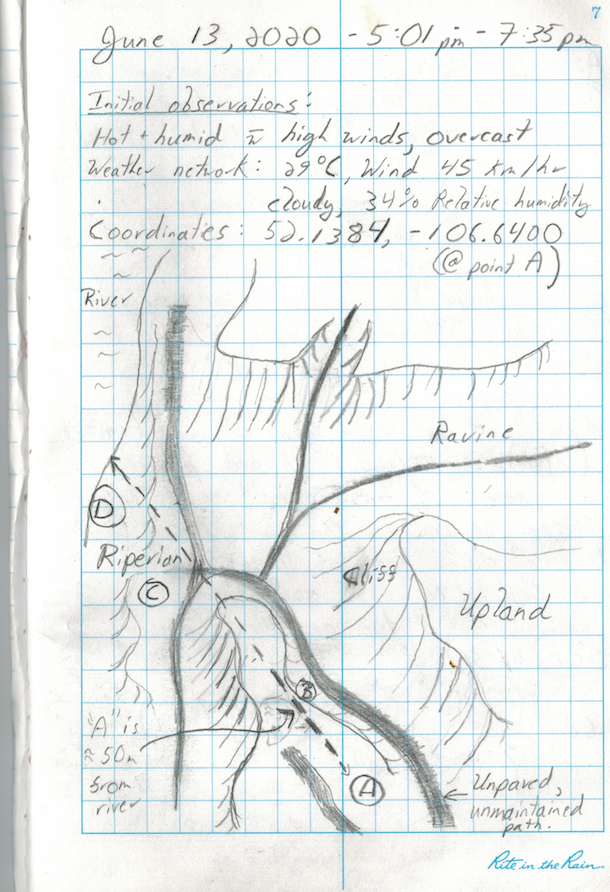
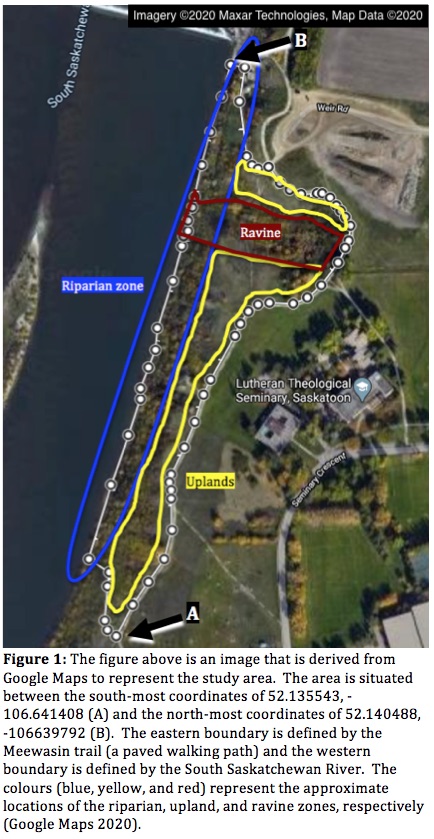
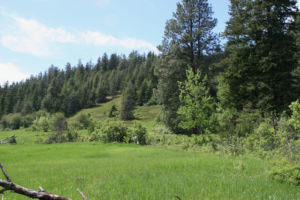
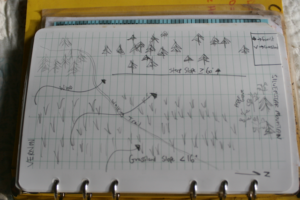
I had a lot of trouble implementing my initial sampling strategy. Originally, I intended to systematically observe forb density and richness (0.5m by 0.5m quadrats) along transects extending down the slope from the uplands, through the riparian zone, and ending at the South Saskatchewan River. However, the varying steepness of the study site would not allow me to descend straight down the hill in many locations. This forced me to navigate to the subsequent plots from various angles and paths (in the interest of preserving the integrity of the transects). Knowing the amount of time that this would take when scaling my replications up to statistically valid levels, I opted to change my sampling method to a haphazard one while out in the field. I would select an appropriate location (which was, obviously, subjective) and lay the quadrat down before examining the forbs too closely at that location (in an attempt to mitigate some of my bias).

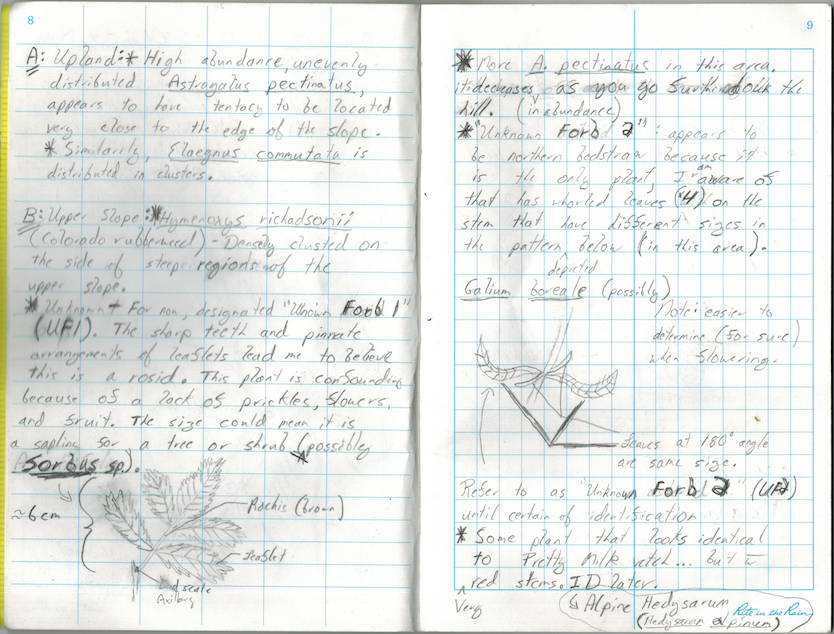
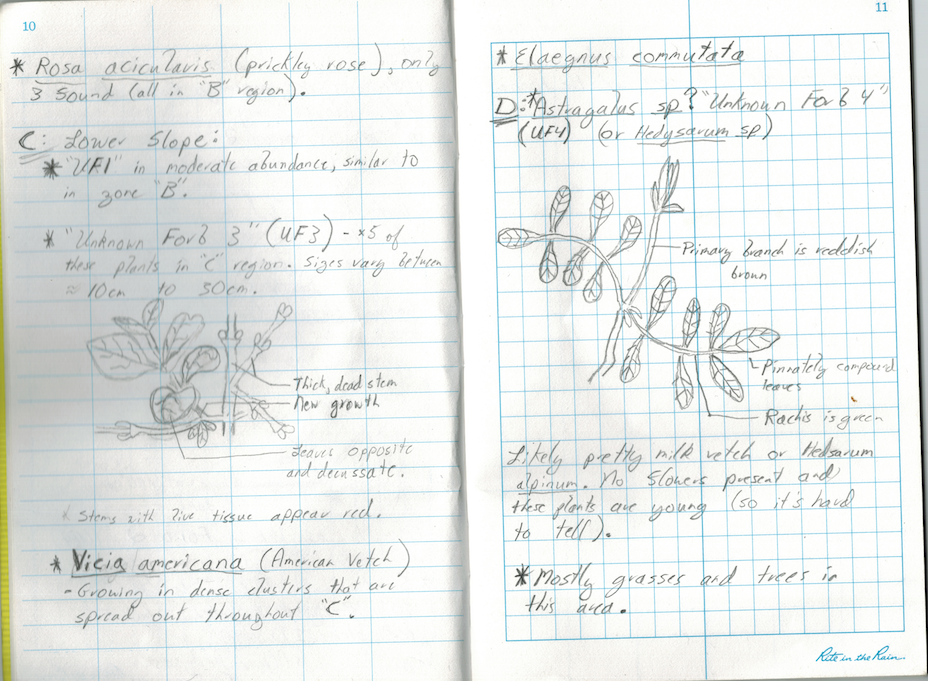
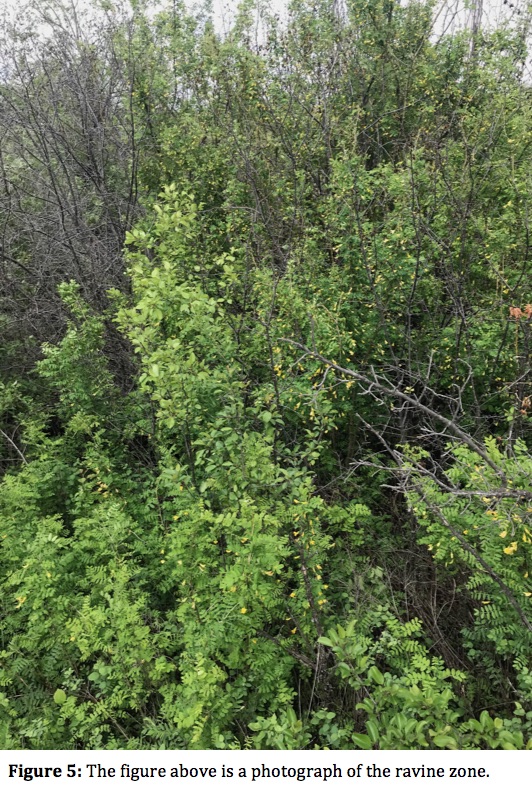
Something that I found surprising in my data was how a close examination of the forbs at each quadrat revealed how low in abundance they could be. I found myself, often times, looking at shrubs and saplings (of which I am excluding from my study). When this occurred: I would choose a location to sample based on it containing high abundance of broad-leaf foliage, begin examining the species, learn that they were mostly shrubs (such as Alemanchier alnifolia, or Rosa acicularis), then have to move on to the next quadrat without having any data related to my study of forb density. Having this preliminary data is useful because it does indicate that, when moving forward with my formal data collection for the study, I will need to ensure I have a high level of replications in order to capture the forb diversity in the area.

I do not intend on continuing the sampling strategies I implemented for module 3. I am planning on moving towards a simple random approach to laying down quadrats throughout the region. While transects are a good approach to this site (in theory), I believe that they are too difficult to implement in the study area. In addition, I would like to ensure that I am controlling my own bias and ensuring that the statistical analyses I would like to use are not compromised. Therefore, I, having had some more time to think about it, will be randomizing the coordinates for my replication locations. I acknowledge that randomizing individual quadrats will have the same navigational challenges as transects. However, I also believe that generating coordinates to unnavigable quadrats, needing to discard those points, and generate new coordinates is more favorable than breaking the integrity of systematic placements of quadrats in a transect (or severely restricting the locations that I can chose to generate unbroken transects).

Post 4: Sampling Strategies

In the virtual forest tutorial, a systematic sampling method, a simple randomized sampling method, and a haphazard sampling method were used to determine the frequency of seven tree species. The systematic sampling method involved randomly selecting a point along the southern margin of the study area and running a transect, straight north, through the five topographical regions (Southern Ridge Top, North Facing Slope, Bottomland, South-Facing Slope, and Northern Ridge Top). Samples were then taken from 24 quadrats (alternating between the eastern side and western side of the transect) until the northern margin was reached. The simple randomized sampling method involved generating 24 random locations to collect data. Finally, my haphazard method of sample collection involved attempting to space the quadrats in such a way that they maximized the distance between each other and the edge of the study area.

Based on the estimated sampling times, the haphazard method proved to be the fastest method (12:17 hrs) of sampling, and the simple random sampling method ended up being the slowest (12:45 hrs). However, I think it is worth noting that the systematic sampling method was, anecdotally, the fastest to conduct in the simulation and it seems logical that it should be considerably faster that either of the other two methods. This is because it covered much less walking distance than the random and haphazard method.

The two most common species in the study area were eastern hemlock and red maple. For eastern hemlock, the haphazard sampling method yielded a 6.9% error, the systematic sampling method yielded a 13.2% error, and the random sampling method yielded a 26.4% error. For red maple, the haphazard sampling method yielded a 17.0% error, the systematic sampling method yielded a 5.1% error, and the random sampling method yielded a 5.9% error.   In both cases, the systematic method was more accurate than the random method, and the haphazard varied from being the best and the worst method.

The two most rare species in the study area were striped maple and white pine. For striped maple, the haphazard sampling method yielded a 100% error, the systematic sampling method yielded a 31.4% error, and the random sampling method yielded a 42% error. For white pine, the haphazard sampling method yielded a 98% error, the systematic sampling method yielded a 185% error, and the random sampling method yielded a 49% error.   The systematic sampling method was most accurate for the striped maple; however, the random method wasn’t far off. In the case of the white pine, the systematic sampling method was extremely inaccurate and the random method was the most accurate. The haphazard method was extremely inaccurate in both cases.

Overall, the haphazard method out-performed the other methods for four out of the seven species. However, it was extremely inaccurate with determining the frequency of rare species and red maple. The inconsistent percent error values of the haphazard method lead me to believe that this method has value; however, it is a risky sampling strategy. I believe that the success from my haphazard approach is likely derived from traits that it took from a stratified method. By choosing points that were relatively far away from each other, I, incidentally, chose a similar amount of points in each region (Southern Ridge Top, North Facing Slope, Bottomland, South-Facing Slope, and Northern Ridge Top). Similarly, the systematic method performed well in most cases but had a lot of challenge with the rare species. Therefore, even though the random sampling method only outperformed both other methods in one case, it was the most consistent for determining the frequency of common and rare species.

Post 3: Ongoing Field Observations

The biological attributes that I intend to study are the species richness and abundance of forbs between the riparian, transitional, and upland zones of eastern bank of the South Saskatchewan River.

On June 13, 2020, I chose four locations adjacent to an overgrown pathway leading down, from the upland region (at the coordinates of 52.1384, -106.6400), towards the South Saskatchewan River. Based upon preliminary observations, each of the four locations (A, B, C, and D) (Fig. 1) have their own distinct vegetation structure. I have chosen to focus in on forb species because of the striking difference between species and abundance at each location. In addition, forbs appear to be present in each location; the same cannot be said for shrubs and trees (with shrubs occurring in high abundance in the upland and trees occurring in moderate abundance towards the river. Furthermore, based on these observations, species richness of forbs appears to be highest in the middle of the riparian zone, and lowest along the river and in the upland.

Therefore, I hypothesize that the distance between the river and the uplands influences the community structure of forb species. Along those lines, I predict that the richness and abundance of forbs will increase approaching the centre of the riparian zone. A potential response variable is the species richness and a potential explanatory variable is elevation. Both species richness and elevation are continuous variables.

Figure 1: The figure above is a drawing of the topography of the four sites (A, B, C, and D) that I have selected to observe the species richness and abundance of forbs.

Blog Post 4

For this tutorial I used the distance-based methods for sampling in the Snyder-Middleswarth Natural Area. In looking at the results of the three different sampling methods used for this exercise, the fastest estimated sampling time came from using random sampling method.


1)Simple Random

  • Eastern Hemlock- (537.1-469.9)/469.9 *100 =14.3%
  • Sweet Birch – (121.6-117.5)/117.5 *100 = 3.5%
  • Striped Maple – (30.4-17.5)/17.5 *100 = 73.7%
  • White Pine = (0-8.4)/8.4 *100 = 100%

2) Systematic

  • Eastern Hemlock = (310-469.9)/469.9 *100 =34%
  • Sweet Birch = (87.4-117.5)/117.5 *100 = 25.6%
  • Striped Maple = (31.8-17.5)/17.5 *100 = 81. 7%
  • White Pine = (0-8.4)/8.4 *100 = 100%

3) Haphazard

  • Eastern Hemlock = (490.4-469.9)/469.9 * 100 = 4.4%
  • Sweet Birch = (129.5-117.5)117.5 *100 = 10.2%
  • Striped Maple = (9.3-17.5)/17.5 * 100 = 46.9%
  • White Pine = (9.3-8.4)/8.4 *100 = 10.7%

The most accurate sampling strategy for the most common species and least common species was haphazard sampling. For the second most common species the most accurate sampling method was simple random, and for the second least common species the most accurate was haphazard. In all three methods the accuracy dropped as species abundance dropped. Surprisingly, haphazard sampling appears to be the more accurate strategy in this situation. However, I do not understand why an estimated value would ever be exactly 0. Would there not always be a slight chance of the above species occurrence regardless of sampling method?


Blog 2: Sources of Scientific Information

For this Blog post I chose to use TRU’s online library database to search for an article. The article I chose is called Succession after reclamation: Identifying and assessing ecological indicators of forest recovery on reclaimed oil and natural gas well pads.

a) The source is from the journal ‘Ecological Indicators’ through the publisher Elsevier. Click here for link

b) I determined that the category of information source for this article is Academic Peer Reviewed Research Material.

c)I determined it is academic because it was written by experts in the field from the University of Alberta and the Alberta Environment and Parks, contains in-text citations, and a bibliography. It is academic research material as it contains a ‘Methods’ and ‘Results’ section.

I concluded that it is peer-reviewed not because the author(s) directly stated it in their ‘Acknowledgement’ section but because the publishing company Elsevier by which this article was published states on their website that they are the “leading platform for peer reviewed literature” (Elsevier, 2020). The authors did however thank, by name, the multiple people involved in the project.


Sources:

Elsevier. Retrieved from: elsevier.com/solutions/sciencedirect/content


Blog Post 2: Sources of Scientific Information

The source of ecological information that I have chosen is a journal article titled “Cross-scale dynamics in community and disease ecology: relative timescales shape the community ecology of pathogens” and it is available at the following link: https://esajournals-onlinelibrary-wiley-com.ezproxy.tru.ca/doi/epdf/10.1002/ecy.2836. The journal article can be classified as “academic, peer-reviewed, research material” (as defined in Module 1).

The article is “academic” because it is written by experts (given that the study is associated with the Department of Ecology, Evolution, and Behavior at the University of Minnesota), in text citations are present, and a “Literature Cited” section is included.

The article is peer-reviewed. No acknowledgment of referees is included in the article. However, a reference to the corresponding editor (in addition to received, revised, and accepted dates of Feb-8-19, May-15-19, Jun-25-19, respectively) is included. Furthermore, the official website for the journal, Ecology, indicates that it conducts peer review and provides instructions for manuscript submissions.

The article can be considered research material because it includes “Methods” and “Results” sections. In addition, while the article’s authors use existing models to derive their methods, they run their own, novel simulations to acquire data. Therefore, the work related to this article could be described as experimental.


Reference List:

Read full aims and scope [Internet]. c2020. Washington, DC: Ecological Society of America; [accessed 2020 Jun 9]. https://esajournals.onlinelibrary.wiley.com/hub/journal/19399170/aims-and-scope/read-full-aims-and-scope.

Strauss A, Shoemaker L, Seabloom E, Borer E. 2019. Cross-scale dynamics in community and disease ecology: relative timescales shape the community ecology of pathogens. Eco [Internet]. [2020 Jun 9]; 100(11):e02836. Available from: https://esajournals-onlinelibrary-wiley-com.ezproxy.tru.ca/doi/epdf/10.1002/ecy.2836 DOI: 10.1002/ecy.2836.

Blog Post 1: Observations

The area that I have chosen to observe is a narrow stretch of civic land (approximately 38 576 m2 in size) located between the University of Saskatchewan and the eastern side of the South Saskatchewan River in Saskatoon Saskatchewan. The coordinates of the South-most point of the study area are 52.135543, -106.641408 and the coordinates of the North-most point are 52.140488, -106.639792. The site was first visited between 1515 and 1850 on June 7, 2020. During the visit, the weather was overcast with sporadic drizzle, high winds, and a temperature of 14OC. Observing the area revealed that there are three distinct areas (the riparian zone, the uplands, and the ravine) (Fig. 1, Fig. 2) divided by their elevation, vegetation, and vertebrate species. The uplands sit approximately 20 meters above the river surface and transition to a riparian zone over a steep bank. Furthermore, a ravine (serving as a swale for the University of Saskatchewan) resides in the northern region of the study area.

The riparian zone is extremely overgrown and contains many unmaintained footpaths that wind down towards the river (Fig. 3). The area exhibits a high level of species richness in vegetation including a high abundance of Vicia cracca (tufted vetch), Juniperus spp. (juniper), Gaultheria hispidula (creeping snowberry), and Vaccinium vitis-idaea (bog cranberry) making up the underbrush. Meanwhile, Pinus spp (pine), Picea spp. (spruce), Acer negundo (box elder maple), Ulmus americana (American elm), Amelanchier alnifolia (Saskatoon berry), and various Prunis species are the primary components of the canopy. Very few arthropods were observed (likely because of the high winds, cool temperature, and high precipitation throughout the week leading up to the visit of the site). However, scarring and galls (including Cynipid wasp galls) on leaves throughout the area indicated that there is an insect presence. In addition to vegetation and arthropods, Canadian geese, ducks, and various songbirds could be seen throughout the riparian zone.

The upland region of the study area is flanked, on the eastern side, by a paved walking path (the Meewasin Trail) that has several meters of grass cut around it. Beyond the cut grass is an area characterized by (mostly) low-lying wild flowers, grasses, and shrubs (Fig. 4). Aside from grasses, the dominant vegetation species appeared to be Saskatoon berry, Elaeagnus commutata (wolf willow), and Astragalus pectinatus (narrow-leaved milkvetch). Similar to observations in the riparian zone, very few arthropods were observed in the uplands. However, multiple ticks (likely Dermacentor variabilis) and indicators of insect foraging were present on vegetation. Anecdotally, the abundance of Cynipid wasp galls appeared to be higher in the uplands than the riparian zone. In addition, there were fewer songbirds observed in the uplands than in the riparian zone. Furthermore, aquatic vertebrate species were replaced with Corvus corax (ravens), Corvus brachyrhynchos (crows) and Pica hudsonia (magpies). In addition, many Urocitellus richardsonii (Richardson’s ground squirrels) were present in the area.

The final area to be observed in the study region was the ravine. As the remnants of equipment and a placard close to the location indicate: it used to serve as a ski hill. The area now serves as a swale for the University of Saskatchewan. A shallow creek runs through the bottom and the area is surrounded by dense vegetation that is mostly composed of box elder maple, Caragana, and Populous balamifera (balsam poplar) (Fig. 5). The interior area of the ravine, superficially, appeared to have it’s own vegetative composition. However, as the ravine extended towards the river, it adopted a vegetative structure similar to the riparian zone. In addition, there appeared to be a high level of black knot fungus infecting the trees of this region.

Questions:

  1. Does the species richness or biodiversity in plants change as the upland region transitions to the riparian zone? Anecdotally, this appears to be the case; however, I am curious to see if it is statistically significant and if this varies between individual species. It was particularly interesting to see how the various species of vetch and milkvetch varied as I descended the riverbank.
  2. Do the incidences of disease or parasitism change from area to area? The abundance of Cynipid wasp galls, and black knot fungus seem to vary based on the region.
  3. Despite the transition area from the riparian zone to uplands being extremely narrow, it seemed like an extreme coincidence that I observed no corvids in the riparian region. Therefore, I would like to know if the bird species vary between these areas.


REFERENCE LIST:

Google Maps [Internet]. c2020. Canada: Google Maps; [accessed 2020 Jun 7]. https://www.google.ca/maps/@52.1379795,-106.6406591,615m/data=!3m1!1e3

Blog 1: Observations

The area I have selected for this research project is a transitional zone between a grassland and forest landscape located in Vernon BC. Despite this site being undeveloped and natural it is in close proximity to adjacent property development. I first visited this site on June 6th 2020. It was a sunny 10 degree morning.

The size of the study area is approximately 5000m2 with an elevation of 750m. The slope aspect is East and on a continuous 16 % slope in which the grassland meets the forest. There is also a steeper section of forested landscape that ranges from 60 to 80% slope. It falls within the Interior Douglas-fir BEC zone classification for ecosystems as indicated on iMapBC.

Observed Tree & Shrub Species:

  • Pseudotsuga menziesii
  • Pinus ponderosa
  • Populus tremuloides
  • Pinus contorta
  • Amelanchier alnifolia
  • Symphoricarpus albus
  • Rosa gymnocarpa

Observations:

While comparing the vegetation and ecosystems variance on this site I noticed that the lush grassland was primarily restricted to the more gentle slopes (<16 )where as the adjacent steep slopes (> 60) was an open forest type ecosystem composed of Fd and Py. On another note, I noticed that in the short time I was on site there was considerable mix of complete calm with occasional gusts of heavy wind. I suspect that the topography plays a role in funnelling the wind alongside this mountain. I also found what I assume to be the femur of cow adjacent to edge between grassland and forest as well as a dilapidated wooden structure.

Questions:

  • How does slope and/or site specific weather patterns influence vegetation and ecosystem composition?
  • Do soil properties change between grassland and the adjacent forest ecosystem?
  • Was the grassland at one time pasture for grazing livestock? If so how has that impacted vegetation/soil properties?

16 Oaks Community Garden – Vancouver, BC

Hello Professor Hebert and classmates of Biology 3021 and welcome to my blog posts for my selected ecology field research project.

I’ve selected a private urban community garden in the City of Vancouver, known at 16 Oaks Community Garden. This area is located on private land and is used by garden members who join at-will, including administrative costs and required labour requirements for remaining in good standing for membership.

Here is a photo looking northeast across the garden towards the intersection of Oak St. and W. 16th Ave.

My initial research topic(s) is as follows and will be narrowed as data is gathered in addition to input from classmates and instructors.

  1. Novel biodiversity study of insects in this Urban Community garden ecosystem
  2. Novel biodiversity study of invasive insects in this Urban Community garden ecosystem
  3. Novel biodiversity study of native insects in an Urban Community garden ecosystem in a location with potential contaminants of concern (PCOCs)


The location of this garden is at the intersection of W. 16th Avenue and Oak Street in Vancouver, British Columbia. The coordinates are as follows:

49° 15′ 24″ N 123° 7′ 40″ W

The garden’s relative elevation is 60m. This data was collected using the Compass application native to the iOS operating system 13.4.1 on 2020-05-31 at 18:02:00.

The time of data collection was 18:01:01, with the date being 2020-05-31. Weather at time of initial survey was partly cloudy with full sun. There was a breeze of unknown speed in the direction of northeast.

The current season is this hemisphere is Spring and the temperature was 19.4°C, collected using a standard household meat thermometer placed in open air and allowed to condition to surrounding environment for approximately10 minutes.

Using a standard 30m length survey tape, the approximate dimensions of the square garden is 34.8m along Oak Street, and 34.67m along W. 16th Avenue. The total area of the garden is approximately (34.8m x 34.67m) = 1207m^2.

The topography is ungraded, sloping and undulating in areas where draining is incomplete. Overall the community garden slopes toward the northeast. The land is covered in a mix of grass, clover and wild flowering plants, with the inside perimeter lined with a mix of low brush, flowers and occasional trees. Throughout the internal garden there are raised and ground-level garden beds. These beds consists of fruits, flowers, and vegetables. Absent of human input, the garden most closely resembles a meadow ecosystem.

Here is a photo of some suspected meadow buttercup, or Ranunculus acris L. growing between garden beds (Klinkenberg, 2020).

Thanks for your time and attention and I hope you’ll stay tuned to this exciting research project focused on biodiversity in urban ecosystems.

References:

Klinkenberg, B. (2020). E-Flora BC: Electronic Atlas of the Flora of British Columbia. Lab for Advanced Spatial Analysis, Department of Geography, University of British Columbia.

Post 2: Sources of Scientific Information

The source of scientific information I have chosen is a study on the abundance of marsh birds that inhabit the marshlands of the Great Lakes. This scientific paper is an important source of information that I can use as part of my research project as my study site is within a marsh that is connected to Lake Ontario. The paper was accessed from: https://longpointbiosphere.com/download/Birds/Timmermans-Badzinski-Ingram-2008-Marshbirds-GL-Hydrology.pdf

This is an academic peer-reviewed, research paper. The paper was written by experts in the field of both ecology and hydrology. It has a methods, analysis, and results section, with in-text citations and an extensive bibliography. As well, the paper cites two reviewers in the acknowledgment section.

I determined this using two reference materials. The tutorial link, How to Evaluate Sources of Scientific Information in Module One of this course has a flow chart that goes through steps of how to determine the four different categories of information sources. This paper falls in the category of an academic peer-reviewed, research paper by following the criteria through the flow chart. I also referred to the Module One reading of A beginner’s guide to reviewing manuscripts in ecology and conservation (Lepczyk and Donnelly, 2011). This paper provides a more thorough discussion on how to review scientific information sources. Within this paper, there is a figure (Box 1) that provides a quick reference guide for reviewing an information source. Based on this guide, I determined that it was an academic peer-reviewed, research paper as most of the criteria could be answered with a ‘yes’.

References

Lepczyk, C. A. & Donnelly, R. E. (2011). A beginner’s guide to reviewing manuscripts in ecology and conservation. Ideas in Ecology and Evolution, (4) 25-31. doi: 10.4033/iee.2011.4.4.c. CC BY 3.0

Timmermans, S.T.A., Badzinski, S.S., Ingram, J.W. 2008. Associations between Breeding Marsh Bird Abundances and Great Lakes Hydrology. Journal of Great Lakes Research, 34:351-364. Accessed from: https://longpointbiosphere.com/download/Birds/Timmermans-Badzinski-Ingram-2008-Marshbirds-GL-Hydrology.pdf