For the sample strategies, I used area based sampling techniques. The sampling time was actually very close to the same for all three strategies, with systematic being the fastest at 12 hours, 37 minutes, random being second at 12 hours, 39 minutes, and finally haphazard at 13 hours, 1 minute. The percentage error for the two most common species found systematic and random to be the most accurate. But looking just at eastern hemlock, the most common species, Random was the most accurate, then systematic, and finally haphazard. The percentage errors found in the two rare species varied more so, with systematic actually being the least accurate overall. However, looking at just the most rare species, white pine, Random was the least accurate, as there were no white pine found in those sample plots, systematic was next, and haphazard was the most accurate. The accuracy generally decreased as species abundance decreased, which is logical, as some sampling strategies found none of the rare trees, making their percentage of error 100%, which is more likely to happen the less frequent a species is. When the species abundance is higher, systematic and random sampling appear to be more accurate, while haphazard just happened to more accurate in rare species. The transect lines being used (systematic) for rare species is the least accurate as the area is large, and following a single bearing is unlikely to capture all that the area encompasses. However, if the area was stratified before sampling, a transect line would be as accurate. So, all the sampling strategies are likely close to the same accuracy, and if done properly, all strategies likely have very similar accuracy.
Category: Percy Hebert
Post 3 – Ongoing Field Observations
As I stated earlier, Cottonwood park is a place I go to very regularly to walk my dogs. I have been having troubles pinning down an organism or an attribute that I can study, as it cold, there is 10-20cm of snow on the ground, and the majority of the plant species are dormant or hidden, and identification between branches can be difficult.
One thing I noticed were the rosa sp. species, as some still have their rose hips persisting through the cold. It may be possible that there are actually two different species of rose, Rosa acicularis (Prickly rose), and Rosa nutkana (Nootka rose). I thought if I could differentiate between the two, I could study if one species had more rose hips persisting through winter than the other. However, differentiating between these closely related species is difficult even when there are leaves and flowers, let alone when there are just decaying fruiting bodies.
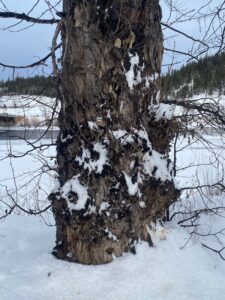
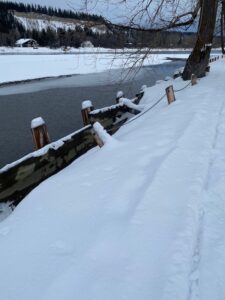
Moving forward, I made some more field observations this morning (December 24). I walked the loop on the east end of my study area from 6:00-7:00am. The temperature was -7 degrees, with a wind chill of -15 degrees, and the sky was overcast. It was still dark and everything is always very quite at this time. It is rare that I see anyone. However, this is the time of day where I usually see the local fox and hares. Unfortunately, I did not see either this morning, but I did see a high amount of hare tracks, of all different sizes (Figure 1). I see a surprising amount when walking in the morning, as my headlamp allows for attributes to stand out.
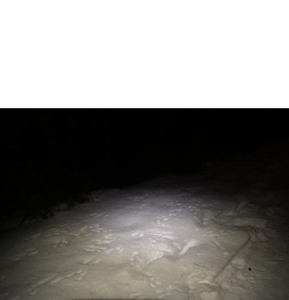
Figure 1: Hare tracks in the snow.
Though I find the animal aspects of the park very interesting, I think it would be troublesome to study as I will always have my dogs with me when I am at Cottonwood, which usually leads to most wildlife running away.
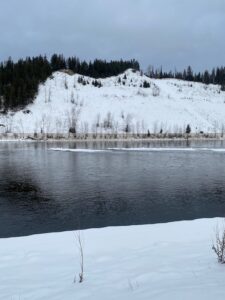
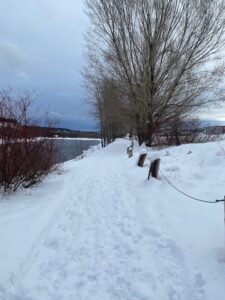
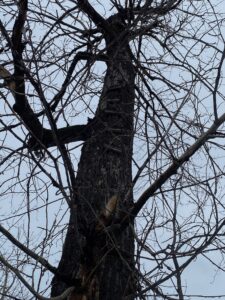
Next, I thought I would focus on the flora of the area. Concentrating on the island portion of the park, I noticed that there were some areas that contained more coniferous tree species than others. This area is predominantly Cottonwood (Populus balsamifera), with large veterans in the overstorey, and the multiple clones in the understorey, as well as many other riparian type woody shrubs and herbaceous plants (Figure 2).
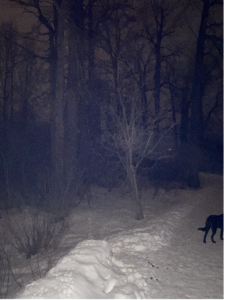
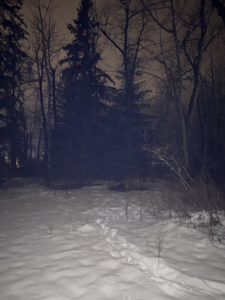
Figure 2: Left, photo showing large veteran Cottonwood trees; Right, photo showing more coniferous trees.
With that said, I have decided to study the density of coniferous trees on different parts of Cottonwood island. I am going to use three areas. There is an inlet from Nechako river that makes a portion of this park an island. I am going to use this as my gradient. An area at the intake of the inlet, one in the middle, and one at the end of the inlet (Figure 3). My initial observation is that there are more coniferous trees around the middle section of the island inlet. I believe this is because the areas near the beginning and the end of the inlet are narrowing and closer to the Nechako and inlet water, increasing soil moisture , thus increasing the density of Cottonwood trees that are able to out-compete the coniferous species. I believe there is a relationship between the density of understorey cottonwood and the density of coniferous species, and my hypothesis is, that in areas with less cottonwood regeneration, there will be more coniferous trees.
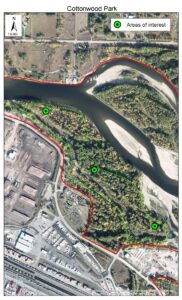
Figure 3: Locations at Cottonwood park island along the gradient.
The response variable in this study are the Coniferous trees and the predictor variable are the number of regenerating cottonwood stems. Both my response variable and predictor variable are categorical as they will be classified into presence/absence counts.
Post 2 – Sources of Scientific Information
- “Snowshoe hares display limited phenotypic plasticity to mismatch in seasonal camouflage” – M.Zimova, L.Scott Mills, P.M Lukacs, M.S Mitchell. 2014. https://royalsocietypublishing.org/doi/pdf/10.1098/rspb.2014.0029
- This is academic, peer-reviewed, research material.
- This is an academic paper as it was written by experts in the field of wildlife and biology, it includes in-text citations, and contains a bibliography as well. This is peer-reviewed material as all published works in this particular journal (Royal Society Publishing) must be peer-reviewed before publishing. Finally, this is research material as there is a type of methods section, as well as a results section.
Cottonwood Park
For my field observations, I have chosen Cottonwood Park in Prince George, BC. This is an interesting area, as it is a city park where the Fraser River and the Nechako River meet, but the majority of my study area only includes the Nechako river. This area is a river bottom, which is surrounded by industrial sites on the south side, and a very steep cut bank on the north side. My study area is in the SBSmh and is approximately 200 hectares in size, which includes the area of the adjacent rivers, but my observations will mainly occur on a 4.8km trail that I walk regularly (Figure 1).
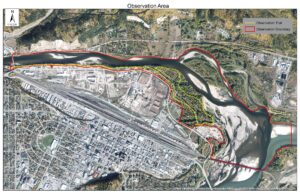
Figure 1
However, I rarely walk the whole trail loop each time. As I do walk there often, I usually walk different sections at different times of the day and/or week.
To begin my observations, I walked the western portion of the trail on December 17, 2019, from 12:00-12:50pm. The sky was overcast, it was very windy, and was approximately 4 degrees. There was a big snowfall on the previous day, about 10-20cm, but it is already starting to melt due to the temperature. This park, as one could likely have guessed, contains many cottonwood trees. There are big veteran cottonwood stems all along the river bank, as well as many regenerating clones in the understorey.The understorey vegetation is surprisingly limited for a seemingly wet site. The only noted species were red-osier dogwood, black hawthorne, saskatoon berry, mountain ash, rose, as well as some different grasses. Parts of the river are frozen at this time, but only at the edges or in shallower areas. There isn’t much as far as animal signs, other than squirrel sightings today. However, as I do spend a lot of time here, I have seen chickadees, magpies, ospreys, hawks, eagles, hares, foxes, and bears during other visits. There are many signs of erosion here, as the trails have had to be moved in some spots, the retaining walls have begun to fall, and the concrete is cracked and broken throughout.
Some observations that I have made that may have potential for a research hypothesis are:
- Does the fur color of hares change due to temperature or snowfall?
- There appears to be only one fox that occupies the area, is this due to food, habitat size, predators, or industrialization in the area?
- Do cottonwood trees that are closer to the river rot faster or slower than those closer to the road?
Post 9: Field Research Reflections
I had no prior post-secondary background in ecology and this course has given me a good glimpse into this field. Conducting the experiment enabled me to see the work that ecologists have to undergo in order to form ecological theories. Performing the field work myself makes me more appreciative of what ecologists do.
The implementation of my research project was pretty straightforward but I did have to slightly modify my experimental design to work more cohesively with my particular research topic. Simply going out to count flowers in the park was not enough. I had to take into account different factors that I hadn’t considered before this project, including the fact that flowers can “migrate” by attaching to humans and animals and by being deposited in other areas (whether within the park or not). Lastly, because this is scientific research, I cannot assume anything is just the way it is based on what I have observed, but rather, I must investigate why things are the way they are.
Post 8: Tables and Graphs
Prior to going into the park, I already knew that I wanted to collect my data in table format versus writing a summary for each quadrat. I did not have initially know what data I wanted to collect until I went to an area of the field where some dandelions were located. This initial assessment was not included in my final data collection but served as a way for me to decide what information I wanted to take note of when summarizing each quadrat.
I eventually decided on the following columns for my table: location of quadrat, total number of flowers, flower type, number of each flower type, and other notes.
My results were as expected because the northern (both northeastern and northwestern) areas of the park had the greatest number of flowers. These results were similar to my initial observations when I only included dandelions. Surprisingly, the centre quadrat had more flowers than I expected, considering it is a flat-lying area and is typically walked over often by both humans and animals.
Post 7: Theoretical Perspectives
My study initially investigated the abundance and distribution of dandelions in an urban park. However, because I observed that dandelions were not present in the park throughout the whole year, I will explore the abundance of flowers (in general) in different areas of the park in relation to the frequency of human and animal use. The reasoning behind this idea is through observations of a greater amount of flowers in areas of General Brock Park that humans and animals are less likely to frequent or use.
Three keywords that can be used to describe my research project are: flower, abundance, urban parks
Sources of Scientific Information
For this assignment I chose two sources to discriminate among different sources of information. The main tool I used was our online tutorial flow chart and associated readings from Module 1.
A) Book off my Shelf
Title: The New B.C. Roadside Naturalist A Guide to Nature along B.C. Highways by Richard & Sydney Cannings
B) classify it into one of the four types of information discussed in the tutorial
Non-academic material
C) provide documentation to support your classification
There are no in-text citations and it does not contain a bibliography though is was written by an expert in the field.
A) Textbook on my desk
Title: Freedman, B., Hutchings, J., Gwynne, D., Smol, J., Suffling, R., Turkington, R., Walker, R. & Bazely, D. (2015). Ecology: A Canadian Context. 2nd edition. Toronto, ON: Nelson Education.
B) classify it into one of the four types of information discussed in the tutorial
Academic peer-reviewed review material
C) provide documentation to support your classification
Ecology: A Canadian Context was written by experts in the field, has in-text citations and references. In the acknowledgements section it thanks colleagues for their review efforts. It does not have a methods and results section which means it is not research material.
Lost Lake, Mundy Park, Coquitlam, BC – Elise Galuska
| Weather/Temperature | Date | Location | Time | Animals | Plants |
| Overcast, light drizzle, 8 degrees Celsius | 6-12-2019 | Lost Lake, Mundy Park,
Coquitlam, BC |
1400 – 1445 | Hooded mergansers | Red elderberry – Sambuca racemose |
| Raven – auditory | Western redcedar – Thuja plicata | ||||
| Douglas-fir – Pseudotsuga menziesii |
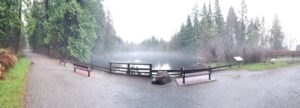
As I arrived at the Lake it was shrouded in mist, obscuring my view on the north side. As I continued to observe the plant life at the lake, the mist started to lift and that is when I noticed the hooded mergansers. The male was showcasing his display for the female. The female would start to come closer to the male then retreat. This was repeated many times, only interrupted by their diving underwater.Lost Lake is found on the eastern side of Mundy Park in Coquitlam, BC. It is a small lake in a dedicated forested (City park) surrounded by urbanization of residential housing and schools on all sides. Lost Lake is the smaller of the two lakes in Mundy Park, the larger being Mundy Lake. Lost Lake is special in that it is known to house a species-at-risk, Western Painted Turtle – Coastal Population and to provide possible habitat to other species-at-risk such as the red-legged frog and the pacific water shrew. It is a permanent body of water, that is usually still with an outflow on the southeast corner into Lost Creek that flows in a general southerly direction toward the Fraser River.
The vegetation surrounding the lake is mainly conifers with some deciduous shrubbery closer to Lost Creek. The majority of shrubs were devoid of leaves but some had leaves turning colour. The red elderberry had bright yellowed leaves, of the leaves still remaining on the shrub.
Lost Lake is inaccessible to park users on all sides except on the south side, where I stood, there is a viewing area with benches. There is also a trail that goes near the lake on the west side, that runs north – south, but it does not allow access to the lake. I observed many park users walking their dogs off-leash here and some of the dog owners were throwing balls off-trail for their dogs to go and find in the forest.
The lake is about 170 metres long running north to south and about 50 metres wide from east to west. I’ve been to this lake many times throughout the different seasons but this is the first time I’ve seen hooded mergansers using the lake.
- Why are hooded mergansers on the lake at this time of year when I have not observed them at any other time of year on the lake before?
- Is there noticeable degradation of the forested area by park users between Lost Lake and the nearby trails systems?
- Inventory – what is the species diversity of Lost Lake in Winter?
Blog Post 9: Design Reflections
On reflection of my field research project, there were several changes I made along the way following feedback from my professor and fellow students. I found submitting small assignments and blog posts throughout the course helpful in guiding my experimental design, and helpful when writing my final report.
Firstly, I have realised the importance of creating a hypothesis and prediction that are specific and can be proven or disproven with field data results. If a hypothesis wasn’t specific it would be very difficult to confidently say in your report if your statistical analysis has proven or disproven your hypothesis.
During my initial field collection and graph assignment, I learnt that presence/absence data is not the strongest indicator of plant species distribution and density (stems/m2) and ground cover (%) is a more accurate way to quantify plant species distribution. Following my initial field collection, I changed the way I was collecting data on my response variable (i.e., from presence / absence to density and ground cover for snowberry).
During my final field collection, I have learnt to appreciate the time needed to prepare for an efficient field sampling program. When I collected my initial field collection, I realised some inefficiencies in the way I was collecting data which I then amended before undertaking my final field collection. I was manually calculating slope incline as a percentage in the field, which I changed to using a clinometer which was much more efficient in the field. I was originally measuring out my quadrat at each location with a measuring tape and tent pegs, which was time consuming, so I took the time to make a PVC quadrat which was much more efficient in the field. I also decided to increase the data I was collecting, and added soil moisture, light exposure and pH to my field collection, which has proven to be very useful when analysing relationships in my data set.
When I was analysing my data and writing my final report, I appreciated the complexity of the natural world, where more than one or two variables would be contributing any observed patterns ecology. I was focussing on slope incline, but also looked at soil moisture, slope aspect and light exposure. On review of my data I think there are opportunities for future research to look at how these variables interact with each other through an ANOVA. I also identified some gaps and limitations in my data set, where additional study sites and additional data on soil parameters would be valuable.
I have enjoyed the content of this course and undertaking a field experiment which has increased my appreciation for ecology and ecological theory. I appreciate the use of statistics in ecology and the importance of strong data sets. My research focussed on one plant species which would be considered a relatively small-scale experiment and through my literature review I realised how my experimental design could be applied at multiple scales to guide land use planning and decision making. My literature review has increased my appreciation of scale in ecology, made me realise how my research project can be scaled up and applied to mapping systems and used by local, provincial and federal governments to guide land use planning and decision making.
I look forward to applying the knowledge and practicable skills I’ve learnt into my career as an environmental consultant.