On October 2nd between 15:47 and 16:27 I collected field data at Whispering Woods park, Calgary AB. The weather was a sunny 7°C with a light breeze. I took 10 replicates of P. tremuloides (aspen tree) from the bottom of the hill, and 10 from the top of the hill. I used a simple random sampling design to find these replicates. A random number generator was used to locate initial tree, then random number generator was used for subsequent replicates by counting the number of trees based on the random number. I walked from West to East and then back again when I reached the last tree on each side. This is a modification from my previous systematic sampling design. I believe is this new method is an improvement, as it allows me to take 10 replicates instead of 9 and uses a more random process.
This was the second day of snow melting since a large snowfall over the weekend, thus I anticipated having difficulties using my soil moisture probe. I predicted the forest floor to be too wet that the probe wouldn’t be able to record an accurate moisture level, or that the snow would skew all my data. However, it appeared that any leftover snow was sitting on the thick layer of native grasses, such that I only had to brush this snow away to isolate the untouched soil underneath. Thus, soil readings were no trouble. Other than this, I had no problems implementing my sampling design.
So far, the patterns observed have been mostly in favour of my predictions. At the bottom of the hill, the mean soil moisture has been higher at the base of the trees, the mean pH has been more neutral, and the mean percentage of yellow leaves, and leaves lost has been lower. Upon reflection, this appears to suggest that the soil conditions are more moist at the bottom of the hill, which serves as a proxy for tree health.
I look forward to collecting more data over the next few weeks to track these patterns further.
The article titled “Ten-year regeneration responses to varying levels of overstory retention in two productive southern British Columbia ecosystems” was sourced from the TRU Library and is available through Science Direct at the following link (Newsome et al. 2010):
The article is classified as an academic, peer-reviewed research material. The article is classified as academic because the authors are considered experts in the field (i.e., governmental and university), and there is in-text citation and a bibliography. The article is classified as peer-reviewed and it states the article history as received on 6 February 2010, received in revised form 6 April 2010, Accepted 7 April 2010. This article history means there was an opportunity for the article to be rejected, therefore the article has been peer-reviewed. The article is classified as research material as there is a methods and results section, where the article reports on results of the study.
Reference:
Newsome T, Heineman J, Nemec A, Comeau P, Arsenault A, Waterhouse M. 2010. Ten-year regeneration responses to varying levels of overstory retention in two productive southern British Columbia ecosystems. Forest Ecology and Management [Internet]. [cited September 29, 2019]; 260: 132-145. Available from: https://www-sciencedirect-com.ezproxy.tru.ca/science/article/pii/S0378112710002057?via%3Dihub . doi:10.1016/j.foreco.2010.04.012
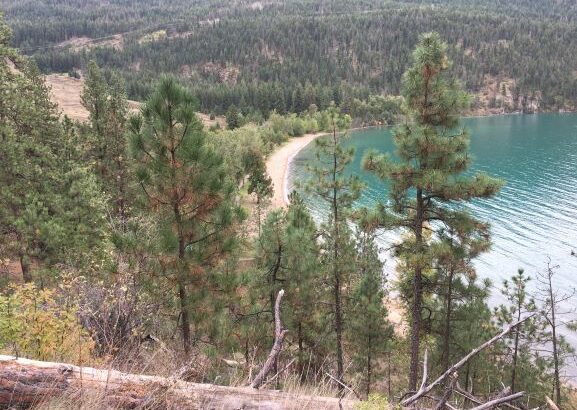
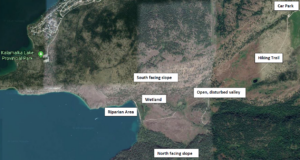
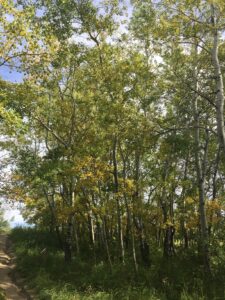
The location I have selected for my field research project is Cosens Bay in Kalamalka Lake Provincial Park, Vernon BC (50011’44” N, 1190 15’40” W) (Figure 1). There is a hiking trail that extends approximately 2.5 km from the car park west, downslope towards Kalamalka Lake. On September 25, 2019 between 17:20 and 18:45 it was 15 degrees Celsius and cloudy. Several ecological communities are present (including forest, grassland and riparian communities) within the Cosens Bay area, of which are associated with the following features: the riparian area of Kalamalka Lake, adjacent wetland, open disturbed grassland, gulley features, south facing slope with an open canopy and a north facing slope. Given the environmental gradient at the site there are several differences in ecological communities to observe.
Figure 1. View of Cosens Bay Hiking Trail and different ecological communities.
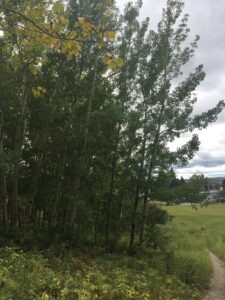
The riparian area of Kalamalka Lake (approximately 400 m above sea level (asl)) consists of a vegetated area approximately 20 m wide and 330 m long with black cottonwood (Populus trichocarpa), interior Douglas fir (Pseudotsuga menziesii) and a stand of trembling Aspen (Populus tremuloides) trees (Photo 1). Several dead black cottonwood trees are wildlife trees with cavities suitable for nesting avian species. Shrub species along the riparian area consist of black hawthorn (Crataegus douglasii), common snowberry (Symphoricarpos albus), Douglas maple (Acer glabrum), tall Oregon grape (Mahonia aquifolium), Saskatoon (Amelanchier alnifolia), rose species (Rosa spp.), poison ivy (Toxicodendron radicans), wild asparagus (Asparagus officinalis) and horsetail species (Equisetum spp.).
Photo 1. View looking south west towards Kalamalka Lake illustrating the vegetated riparian area.
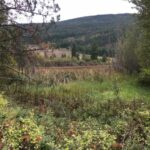
Behind the black cottonwood riparian band is a wetland feature approximately 75 m wide and 170 m long (at similar elevation of 400 m asl) with common cattail (Typha latifolia) dominating the wetted perimeter of the wetland (Photo 2). Other shrub species surrounding the wetland include the aforementioned species.
Photo 2. View looking south east towards wetland feature and area of common cattails.
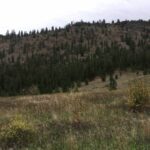
North of the riparian area is a south facing slope extending up to 700 m asl dominated by ponderosa pine (Pinus ponderosa) with some interior Douglas fir trees (Photo 3). The tree canopy is relatively sparse as the elevation increases to 700 m asl with an understorey dominated by bluebunch wheatgrass (Pseudoroegneria spicata). Areas of exposed rock are present indicating shallow soils.
Photo 3. View looking north illustrating the south facing slope, exposed rock and open canopy.
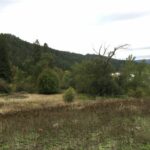
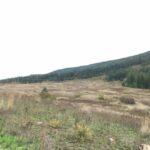
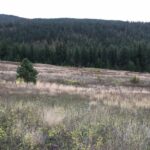
An open valley is between the south facing slope, and a north facing slope. The open valley appears disturbed with a high occurrence of invasive species including knapweed species (Centaurea), mullein (Verbascum thapsus), thistle species (Cirsium spp.), sulfur cinquefoil (Potentilla recta), white sweet clover (Melilotus albus) and chicory species (Cichorium spp.) (Photo 4). Native species within the open valley included thickets of common snowberry and Saskatoon. The north facing slope is more gradual relative to the south facing slope and consists of a dense interior Douglas fir forest (Photo 5).
Photo 4. View looking east illustrating the open, disturbed valley with shrub thickets.Photo 5. View looking south towards the north facing slope dominated by interior Douglas fir trees.
Wildlife observed within the riparian area included birds of prey. A chorus frog was heard adjacent to the wetland area and signs of deer were observed within the open valley. No other wildlife was observed, however the area would likely be used by other song birds and ungulate species.
On review of the different ecological communities, I observed more common snowberry present in the riparian area, surrounding wetland area, and moisture receiving areas within the open valley community. Common snowberry was less dense when the ecological community transitioned to a steeper, south facing slope. In areas where rock was exposed and the understorey was dominated by bluebunch wheatgrass there was little to no common snowberry present.
On review of the ecological communities, the following questions are presented:
Is common snowberry present in moisture receiving areas only?
Is common snowberry more dense in riparian areas?
How drought tolerant is common snowberry?
Is common snowberry important foliage for wildlife in fall and winter?
Does the presence of common snowberry influence the occurrence of wildlife in fall and winter?
Can understanding common snowberry and associated species influence riparian restoration and enhancement to improve water quality and overall watershed management?
Is the riparian area ecological community Red or Blue listed in BC and how does this influence management decisions?
Field notes from September 25, 2019 are attached below.
I collected my initial data on September 23, 2019; most of the collecting went smoothly and as planned, but during the collection and upon reflection some of it requires modification.
One of these difficulties was my sampling strategy. I had planned on using a systematic sampling strategy (explained in my Small Assignment 1) where I would use a random number generator to indicate which initial tree I would sample (at the very top and bottom row of trees on the hill). From there, I would count 9 trees, and 18 trees to the left and right of the initial sample to collect a total of 5 replicates. I realized while I was there; however, that if the randomly generated number was very small or very large, there may not be enough trees on one side of that tree to collect the second and third sample. I decided I would instead count another 9 (or 18, if necessary) trees after the 18th tree on the other side, to make up for this. I am having difficulties determining if this modified method of systematic sampling is “random” enough, yet I can’t think of an alternative.
With regards to the actual data I collected, the mean soil moisture levels at the bottom and top of the hill followed my prediction (the bottom of the hill having a higher mean moisture level). My leaf class strategy (class 1 being trees with 0-5% yellow leaves, class 6 being trees with 95-100% yellow leaves) will likely become more useful as the Fall progresses, as the vast majority of trees at the top and bottom of the hill all fell under the class 1 category. As well, the soil pH readings were very similar at both locations along the elevation gradient, not providing any useful measurements at the moment.
None of this is surprising, as the data I am collecting is likely to change drastically as the Fall progresses. For instance, we are now in our second day of snowfall in Calgary, Alberta, so it should be interesting to study the differences in soil moisture, pH, and leaf colour later this week after a few days of melting. For this reason, I plan to continue the same measurements as in my initial collection to allow for potential changes in pH, soil moisture, and leaf colour to be captured.
However, there are a few modifications to my data collection I would like to make. Firstly, I would like to adapt my data collection to the seasonal progression changes. For instance, as the Fall progresses I will likely add in a leaf loss measurement similar to my leaf class strategy. This way, I can measure the rate of leaf loss on top and bottom hill trees, which will be more applicable than leaf colour at that point. I may add other measurements as well (such as snow depth, to measure water infiltration rate). I also do not want to stick to a specific schedule as to when I collect data. Of course, data collection must be frequent enough to be able to capture changes in the health parameters I’ve mentioned, but I would also like to respond to weather changes. For instance, I will not be collecting data while the location is buried in 1ft of snow, as my pH and moisture meter do not have the capabilities to function in such drastic conditions. Instead I will collect data soon after the snow has melted, to study initial differences among the elevation gradient. Ideally, I would like to collect data no more frequently than every 5 days, but no less frequently than every 10 days (if weather permits).
I believe these modifications will improve my research because they will account for the natural and uncontrollable fluctuations in weather. Modifying the data I will be collecting will allow for my data to stay relevant as the Fall season progresses. Modifying the frequency of data collection will achieve the exact same thing. I hope, through these modifications across time, that I will more holistically be able to capture any differences in tree health among trees located at the bottom and top of Whispering Woods hill.
I didn’t have too much trouble implementing my design, however it was maybe too simple. The data ended up being quite difficult to analyse and if I had larger sample sizes, there may have been a more apparent trend. This is the first research project I’ve carried out on my own, so that was much harder than I expected since I had no one to bounce ideas off of as I saw how things played out. The more I learn, the more complicated ecological theory becomes. I am eager to keep working in this field and to continue learning how to design effective and efficient experiments.
During the virtual forest tutorial, three sampling strategies were used to compare the abundance of different tree species throughout Middleswarth Natural Area. These strategies were the haphazard strategy, the random sampling strategy, and the systematic sampling strategy. I chose to sample by area not distance for the tutorial.
After completing the tutorial, it is estimated that the haphazard strategy was fastest for sampling (12 hours, 29 minutes) followed by the systematic sampling strategy (12 hours, 37 minutes), and the random sampling strategy taking the most time (12 hours, 42 minutes).
For the systematic sampling strategy, the percent errors for the two most common species were 20.2% and 31.2%, while the percent error for both of the two least common species was 100%. For the random sampling strategy, the percent errors for the two most common trees were 4.6% and 8.9%, while the percent error for the two rarest species were 100% and 50%. Finally, the percent errors for the two most common species using the haphazard strategy were 7.8% and 40.5%. The percent errors for the two most rare species were 4.6% and 100%. A percent error value of 100% occurred when no trees of those species were found during the sampling. From this, it can be observed that the lowest percent errors were found by using the random sampling strategy on the most common tree types, while the largest percent errors occurred when systematically sampling the least common species. Even more generally, the systematic sampling strategy yielded an overall percent error of 62.9%, the random sampling strategy yielded 40.9%, and the haphazard strategy yielded 38.2%. From these results, if one strategy had to be used, the haphazard strategy would yield the most accurate data on average.
Generally, as the abundance of a certain species decreased, the percent error increased. This indicated a decrease in accuracy, as the degree of closeness between measured and true values decreased. Conversely, the more accurate data was found in the samples of the most abundant tree types.The most accurate strategy for sampling the most common tree species was the random sampling strategy, and the most accurate strategy for sampling the rarest tree species was the haphazard strategy. It should be noted that the average percent error for the rare species was still much larger than the average for common species. Thus, it is important to understand the expected density and abundance of the species of interest to choose the sampling strategy that will yield the most accurate data. From this tutorial, it is evident that best strategy may not be the same for sampling all tree types. Ensuring the proper strategy is used will allow for sampling data to best represent the population data.
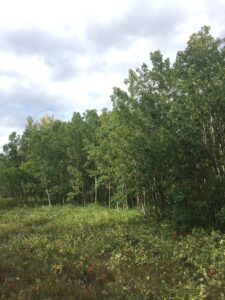
Aspen trees at bottom of hill, looking EastAspen trees on middle of hill, looking WestAspen trees at top of hill, looking East
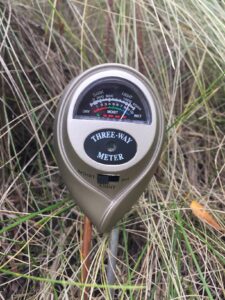
The purpose of this fieldwork was to observe aspen trees, Populus tremuloides, located in Whispering Woods. One of the environmental gradients present at this location is a 12m change in elevation from the bottom to the top of the Woods. Therefore, I chose to observe health attributes of P. tremuloides trees located at the bottom, middle, and top of this hill. The specific attributes I observed were leaf colour (percent of primarily yellow leaves on the trees), soil moisture (measured using a HoldAll® Moisture, Light, and pH Meter™), and soil pH (also measured using a HoldAll® Moisture, Light, and pH Meter™). Soil moisture and pH measures were taken 20-30cm from the base of the tree. Additionally, I looked at general differences in the distribution, abundance, and character of these trees located at the bottom, middle, and top of the hill.
HoldAll® Moisture, Light, and pH Meter™ reading moisture level of soil near a tree at the bottom of the hillObservations recorded in field journal describing differences in leaf colour percentage, average soil moisture levels, average pH levels, and density of trees located along the gradient of the hill slope.Observations from field journal measuring the soil moisture level and pH of n=10 trees chosen using convenience sampling for the bottom, middle, and top of the hill. Average soil moisture and pH also calculated, with rankings shown.
As indicated from the field journal documentation, there were character differences present including the percentage of yellow leaves, soil moisture, and soil pH of the 30 trees sampled (10 from each level of gradient). The bottom of the hill contained trees with almost completely green leaves, a higher average moisture, and a medium average pH. The top of the hill contained trees with primarily green leaves on its West side, and primarily yellow leaves on its East side. Further, trees on the top had the lowest average soil moisture, and most alkaline average soil pH. Trees located in the middle of the hill had a combination of characteristics from both.
Additionally, I observed differences in the abundance of trees, as the top NW contained the densest area of trees, while the bottom SE corner contained the least. These dense trees were also smaller in size on average. The distribution of yellow coloured leaves also was a clear finding, with primarily yellow-leaved trees located on the East side, and primarily green-leaved trees located on the West side for both the trees sampled from the middle and top of the hill. Another important note is that there were not enough trees to sample from the bottom SE corner relative to the width of the hill, so samples taken from the bottom of the hill were taken from trees all on the SW side.
From these observations, I have compiled a hypothesis and a prediction. It is important to note that in this stage of my Field Project, I am choosing to define the “health” of these trees as green leaves, high soil moisture, and a neutral soil pH. As the Fall season progresses, I hope to include other relevant indicators, such as rate of leaf loss, and perhaps water infiltration rate.
My hypothesis is that there is a significant difference in P. tremuloides health (based on the definition above) among trees located along the elevation gradient of Whispering Woods hill. My null hypothesis would therefore be that there is no difference in P. tremuloides health among trees located along the elevation gradient of Whispering Woods hill; any difference is due to chance alone.
Based on this hypothesis, I can make certain predictions regarding the attributes of health I have chosen. I predict that trees located at the bottom of the hill will have a better overall health, indicated by a higher average green leaf percentage, higher soil moisture, and a neutral soil pH. Conversely, I predict that trees located at the top of the hill, on average, will have a worse overall health, indicated by a lower green leaf percentage, lower soil moisture, and a more alkaline soil pH. These predictions are based on my previous knowledge of what plants require to grow optimally.
From these predictions, the response variable would be indicators of tree health (soil moisture, percent green leaves, soil pH) which is a continuous variable. The explanatory variable would be the position of the tree on the hill (bottom or top) which is a categorical variable.
Looking back at the original design of my field research, I recognized a problem getting accurate representation of the mean grass distribution. The grass was naturally distributed in clumps which meant a smaller number of samples would likely result in a misrepresentation of the cover. I made the change to add more transects after the initial collection of data, but I still feel the number of transects could have been doubled to property represent the mean distribution. Prior to taking this course, I took GEOG 3991 Climate Change. I learned about the many negative impacts of climate change on our sensitive ecosystems caused by anthropologic sources. Ecology has deepened my appreciation for how ecologists meticulously gather data which can be used as evidence of the impacts of climate change. I have a greater understanding of the processes that go into research, the time that is in involved in accurately collecting data, as well as the other confounding factors that need to be accounted for.
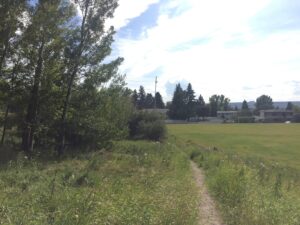
I have chosen to observe a small deciduous forest, approximately 150 square metres in size, located at 51°6’14”N and 114°8’21”W, just outside of the NW Calgary Dr. EW Coffin Elementary School limits. This city park was adopted by the elementary school through the Adopt-A-Park program, but otherwise holds no designation. I visited this site on September 16, 2019 from 3:15pm to 3:50pm. The weather was 16°C and mainly sunny with some cirrus clouds.
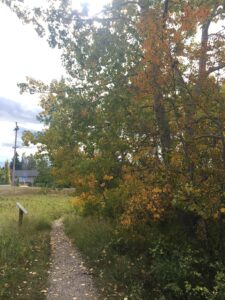
Coordinates of Whispering Woods on informational signLarge, green aspen trees on South face bottom of hill
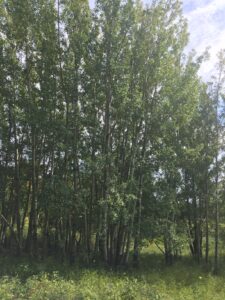
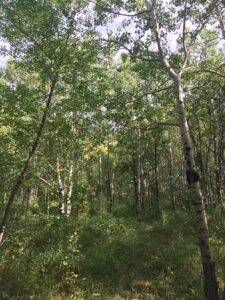
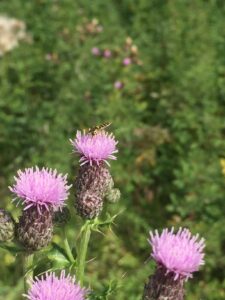
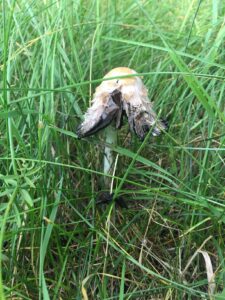
The forest is located on a hillside, with the elevation gain of about 12m, from an altitude of 1130m at the bottom of the forest limits to 1141m at the top. It is primarily made up of aspen trees, both large and small. Beneath these trees sit a variety of flowering plants, berry bushes, thistle, mushrooms, and smaller leaved trees. The floor of the forest is comprised of smooth, brome grass. Large aspen trees are found on the South-West bottom edge of the hill, along with the long, native grass, the thistle bushes, and the mushroom patches. The centre of the forest is more clear of aspen trees and is comprised mainly of smaller bushes. The top of the forest contains densely-packed aspens, none of which are as large as those on the bottom face. Throughout the forest are multiple gravel paths, grass foot-paths, and informational signs. An amphitheater is also located on the North side at the top of the hill. Small, bee-like pollinators were present on the flowering plants, and mosquitoes were identified.
Tall, native grasses on South face bottom of hillDense aspen forest near top of hillPollinating bug on thistle flowersMushroom towards bottom of hill
There are certain observations that caught my attention during my visit. Dandelions seemed to have taken over the centre clearing of the forest, leading me to my first question of interest: What has allowed for this dandelion take-over in the centre forest, and why are they so contained to this area? I also noticed that the aspen trees on the South face were very green, and much larger than the others. Finally, I observed that, on average, the smaller aspen tree leaves appeared to be much more yellow than the leaves on the larger trees. I have multiple questions related to these observations. For one, what factors are causing the smaller trees to turn yellow faster than the larger trees? My final question of interest is less based on an observation I noticed during this visit and more a question for the future: Are there differences in the rate of leaf colour change, and then leaf loss, in the trees located on the top of the hill versus on the bottom? In other words, how does tree position on a hill affect its health as the Fall season progresses with regards to colour change and leaf loss?
Leaves changing colour on smaller aspen treesGravel path to top of hill
I look forward to narrowing down my subject for this research project, as this forest offers many questions waiting to be answered.
My chosen source of ecological information is the article “The vegetation, surface water chemistry, and peat chemistry of moderate-rich fens in central Alberta, Canada” published 1989 by Wai-Lin Chee and Dale Vitt.
This piece of literature would be classified as academic, peer-reviewed research material. I classified it as such for five reasons. Firstly, this is an academic paper because the authors of it are “experts in the field”, as both of them are affiliated with the University of Alberta. As well, the paper contains numerous in-text citations citing other scientific journals, and contains a Bibliography. This research can also be classified as peer-reviewed. While it doesn’t explicitly mention acknowledgment of a reviewer, the journal Wetlands, under which it was published, is peer-reviewed. This was stated in the website that can be found here: https://www.sws.org/Publications/wetlands-journal.html. Finally, this paper is research material, as the authors conducted a field study themselves. The Methods and Results of this research is included in the article.