Post One: Observations: Cates Park

The region I’ve chosen to study is Cates Park, a North Vancouver District municipal park. It is also known as Whey-Ah-Whichen, “Faces the Wind,” by the Coast Salish Tsleil-Waututh Nation, whose territory the park is situated.

📷Perimeter of Cates Park, courtesy: Google Maps

I first visited Cates Park for this study on Wednesday, November 28, 2018, at 1530h. The weather was overcast with light rain and no wind, so the sea state was flat and mirror-like. It was 8°C in late fall, and the tide was ebbing until 1640h, but this low was only 3.1m. Tidal variances in this area can be as high as 5m, but today the change was only about half a metre.

📷Looking east towards Port Moody Inlet, at the Roche Point flashing marker and layers of kelp at various tidal levels along the beach

Cates Park offers an ecosystem to which I am familiar, so the subsequent field observations will allow time and attention to more thoroughly analyze the Coastal Temperate Rainforest and its interactions with the sea. Other points of interest in Cates Park include Coast Salish cultural and environmental history, that Whey-Ah-Whichen is one of a very few seaside parks along the busy, industrial Vancouver shoreline, and is directly across the Burrard Inlet from an oil refinery. Local current events include ongoing environmental protests to stop an expansion of a pipeline that ends across the inlet. Tanker traffic is reported to increase 7 fold.

📷A tanker is escorted out of the Burrard Inlet

Whey-Ah-Whichen is a point of land at the meeting of the Burrard Inlet, Indian Arm and Port Moody inlets, with approximately 60 acres of forest, sandy and rocky seashore, and trails. To its north lies Dollarton Highway, a coastal road towards Deep Cove. The park is influenced by human factors, as visitors walk dogs and picnic with family, kayak and beach comb, and vehicles pass by both along the road and the waterway. The trails are maintained and occasional stairs lead from the forested pathway about 2-5m down to the beach.

The beach is composed of sand, rocks, pebbles and shell midden in some areas, and rises a few metres to meet the forest. A variety of kelp found on the beach include rockweed, turkish towel and sea lettuce. The forest has a gradient from the more sunlit seashore to shadier inland, including shrubs (red huckleberry, salmonberry, salal, wild rose, blackberry, common snowberry), trees (red alder, black cottonwood, broadleaf maple, western hemlock, western red cedar), ferns, grasses, mosses, lichens, bracket fungus, dandelion and ivy. There is a small freshwater stream halfway along the Malcolm Lowry trail and it dischargers on to the beach.
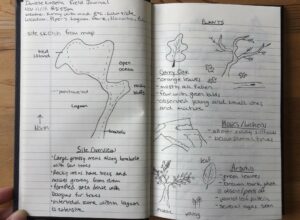
📷Field Notes pg 1
📷Field Notes pg 2

In terms of wildlife, sightings were sparse. Barnacles are abundant, and I expect to see more intertidal life closer to the new and full moons, where there will be more tidal exchange. I’m looking forward to spotting sea stars, shore crabs, harbour seals, small mammals and birds of prey in the future.

📷Barnacles abound

Potential Study Subjects:

Nurse logs are abundant on the coast, as trees that have either fallen or were logged support life for new seedlings. They decompose very slowly and allow their hosted trees to grow for decades and root around them. What nutrients do nurse logs provide, how much of a carbon sink are they, and which plants tend to use them more often as a bed for new growth?

📷Two western hemlock trees encompass a nurse log stump, with buttress roots that cascade toward the ground


Sea stars are a keystone species and top predator in their ecosystem. Recently their populations were devastated in a mass die-off from sea star wasting syndrome. Are there sea stars along in the intertidal zone of Whey-Ah-Whichen, do they show signs of the disease, and to what extent? How has this impacted their prey and other features in the intertidal zone?

The forest along the coast has evolved to thrive next to a salt water environment. What nutrients are brought from the currents of the inlet, how well do trees and shrubs thrive next to the ocean versus inland, and to what extent does the extra sunlight beside the beach help mitigate effects from salt or storms of the sea?

📷Western red cedar branches hang over the seashore


Coast Salish people have used this area for centuries, their culture thriving on the abundance from the ocean and the forest. Are there any culturally modified trees in the park, what portion of the tree was harvested and how well do the trees recover after bark or wood is taken? What food and medicine plants are in the park, and how have these been distributed by the Tsleil-Waututh cultural practises?


Blog Post 4

Results using the three sampling strategies on Snyder-Middleswarth Natural Area

Random Sampling

Total time to sample: 12hrs, 12 mins

% Error for Dominance

Most Common

Eastern Hemlock: 107 individuals, 15.9%

Red maple: 28 individuals, 17.1%

Least Common

Sweet Birch: 19 individuals, 14.3%

Yellow Birch: 17 individuals,  4.8%

Missed the striped maple and white pine entirely

Shannon-Wiener’s index of diversity for the community: 13.3%

Systematic Sampling:

Total time to sample: 12 hrs 12 minutes

% Error for dominance

Most Common:

Eastern Hemlock: 119 Individuals, 1.5%

Sweet Birch: 31 Individuals, 9.4%

Least Common:

chestnut oak: 11 individuals’, 50%

white pine: 2 individuals, 11.1%

Shannon Wiener’s index of diversity for the community: 6.6%

Haphazard Sampling:

Total time to sample: 13hrs

% Error for Dominance

Most Common Species:

Eastern Hemlock: 134 individuals, 5.4%

Yellow Birch: 34 individuals, 2%

Least Common Species:

Striped Maple: 8 Individuals, 157%

Chestnut Oak: 19 Individuals, 1.8%

Shannon Wiener’s index of diversity for the community: 6.6%


Comparing these three strategies it would appear that there is little meaningful difference in which one is most efficient with the time required to collect samples. Both the random and systematic sampling techniques requiring 12hrs and 12 minutes while the haphazard sampling required 13 hrs. In regards to the Shannon Wiener’s index of diversity for the community the haphazard and systematic sampling techniques only had a 6.6% error while the random sampling technique had a 13.3% error. The random sampling had relatively low % errors in the most common species (15.9% & 17.1%) and same for the most common species (14.2% & 4.8%); however, it missed two whole species present in the community. Systemic Sampling had low % errors in the most common species (1.5% & 9.4%), but with the least common species one high percent error 50%. Using Haphazard sampling had all percent errors under 6% except for in one of the two least common species a huge percent error of 157%. Due to these results I would probably deme random sampling the least accurate sampling method despite the haphazard sampling having one sample with 157% error, as it missed whole species and had the highest error Shannon Wiener’s index, while the Systematic Sampling was the most accurate on both accords. It seemed that the less abundant a species the more chance for high error, as they could be missed entirely. I would add that a stratified random sampling technique would probably have been the most accurate in this community as it seemed like some species were only present in small patches of land.

Blog 7: Theoretical Perspectives

My hypothesis is that the Mallard ducks (Anas platyrhynchos) will be much more abundant by the bridge of the moat compared to the mouth of the moat entering the river or the pond in the golf course and after a few days of observations I believe this is mainly due to the landscape composition, primarily water quality. Not many ducks were counted by the mouth of the moat to the river, and this could be due to the speed of the river water, whereas by the bridge the water is much more calm. There was also little to no ducks around or in the pond and after testing the water quality, I believe this to be the main reason.

Keywords: landscape composition, habitat, mallard duck distribution, animal behaviour, patch choice

Blog Post 6: Data Collection

I did my data collection on four separate days, first on September 12, then the 13th, 15th and 19th. I counted the number of ducks in each of the three locations at McArthur Island and categorizing them into each of the four states depending on if the ducks were on land or in water. I repeated this process at three times of the day (10am, 2pm, 6pm). After analyzing my data on the first day I realized that over the course of the day the temperature of the air and water increased, and so the number of ducks in the water increased substantially . At the pond and the river though, there was not much change over the three times I observed the ducks. After viewing this data my hypothesis still hasn’t changed and I will continue to analyze it and make some slight adjustments to my methods

Post 2: Sources of Scientific Information

Danielle Kinsella, November 17th 2018

The source is an online paper titled Integrative biomechanics for tree ecology: beyond wood density and strength from the Journal of Experimental Botany. The paper was retrieved via Google Scholar.

Citation:

Fournier, M., Dlouhá J., Jaouen, G., and T. Almeras. 2013. Integrative biomechanics for tree ecology: beyond wood density and strength. Journal of Experimental Botany, 64(15): 4793–4815 https://doi.org/10.1093/jxb/ert279 (accessed November 11, 2018)

It is classified as Academic, peer-reviewed review material because of the following factors:

Academic material

  1. The information was written by experts in their field, the affiliation of authors with several large institution and universities in France such as AgroParisTech (Paris Institute of Technology for Life, Food and Environmental Sciences), INRA (agricultural science research institution, and the CNRS Centre national de la recherche scientifique.(National Centre of Scientific Research)
  2. The article information includes in-text citations, stating the authors last name and year published, in reference to the bibliography.
  3. The article has a bibliography at the end indicating sources of information used in the paper.

Peer-reviewed, academic material

  1. The source has been reviewed by at least 1 referee before publication, indicated by Revised dates and acknowledgement to an anonymous reviewer.

Received 19 March 2013; Revised 18 July 2013; Accepted 22 July 2013

At the end of the acknowledgements is the sentence: “We are also grateful to Gail Wagman who improved the English, and to an anonymous reviewer for stimulating comments.

Academic, peer-reviewed review material

  1. There is no Methods or Results section in the article, therefore, it is not research material it is review material. Several experiments from other research papers have been compiled into the review paper.

Therefore, the paper is classified as academic, peer-reviewed review material.

Post 1: Observations

Danielle Kinsella, November 16th 2018

The area I have decided to study falls within the Garry Oak ecosystem at Pipers Lagoon Park in Nanaimo, BC. My reconnaissance of the area was November 11th 2018 at 2:55 pm. The weather was sunny with a bit of wind, the temperature was a warm 8°C fall day.

The landscape consists of a tied island attached to Vancouver Island by a ~350m long tombolo. The tied island is 275m long in the NW/SE by 200 m NE/SW (see Figure 1). Together, the landforms create a large lagoon which undergoes drastic water level changes every day with tidal movement. The north side of the park consists of rocky bluffs, however, elevation does not exceed 20 m (see Figure 2). The tombolo has relatively flat topography, while the east side receives direct waves.

Figure 1: Satellite image of study site. Green outline indicates the park boundary and extents. Created using Google Maps.

Figure 2: View of Pipers Lagoon facing North.

The area ranges from forested areas, grasslands with scattered trees and shrubs, to intertidal zones with dense aquatic vegetation. There are a variety of vegetation species within the park, however, the only animals sighted were ducks, geoducks, seagulls and a bald eagle. Along the tombolo is largely grassland with shrubs, with a few Garry Oak and young Arbutus trees. The main portion of the park is forest consisting of mainly Garry Oak, Douglas fir and Arbutus trees. Several shrubs occur along the forest floor as well as some invasive species such as Himalayan Blackberry and English Ivy.

Possible Subjects and Questions

1. What daily fluctuations do the organisms in the intertidal zone undergo each day and how does it affect their internal nutrient composition?

Identifying and studying the species located here, you can determine their relative abundance. This method of analyzing the community may indicate which species is more adapted and able to survive harsher conditions. Another possibility would be to analyze the salt content in different species of plants.

Figure 3: left photo: sea asparagus, right photo: below surface geoducks.

2. Are the invasive plants a threat to the keystone species in this ecosystem? Do they affect all other vegetation species surrounding them?

While observing the Garry Oak tress I noticed along the ground some Himalayan Blackberry plants. They were growing between a young and old Garry Oak (see Figure below), and nearby was a juvenile arbutus tree. English Ivy was also observed along the floor of more dense forest, where it slowly crept up Garry Oak and Douglas fir tree trunks.

Figure 4. Left photo: Invasive species near Garry Oak. Right photo: young arbutus found nearby.

3. Does the spatial distribution of tree species vary along the perimeter of the tied island?

The north side experiences direct wind from the ocean, whereas the south side is protected from harsh winds and does not experience harsh waves. Also, the north side is rocky bluffs where it is too steep for several trees to grow. Are the two areas affected differently by sunlight and/or the physical environment surrounding them, and does it affect which tree will grow there? The three distinct tree types are: Garry Oak, Arbutus and Douglas fir. Walking around the park it appeared there were many places with only a single tree species, or with several.

Figure 5. Left photo: Southwest side of tied island. Right photo: Rocky bluffs on North side of island.

Figure 6. Trees growing out from rocky hill. Left photo: Garry Oak. Right photo: large Arbutus tree.

Figure 7: Young Douglas-fir tree.

Field Notes:

Ecology Blog Post 3

After repeated visits to the Art Gibson Memorial Park I have decided to study the correlation between soil pH levels and the presence of undergrowth. The park is for the most part dominated by an old canopy of coniferous trees underneath which there is minimal undergrowth, but there are small areas of new growth with different species of trees where there is plentiful undergrowth. I have decided to investigate 2 plots approximately 30x50m one belonging to the old growth and another the new growth. There are many factors that could cause the presence or lack thereof of undergrowth, soil moisture, amount of shade cast by the canopy or the pH levels of soil. The park belongs to the biogeoclimatiic  zone ICHdw1 which is supposed to be a typically moist so I doubt there being a change in moisture between such little distance in the two research plots. I hypothesize that there is a correlation between the presence of undergrowth and soil pH, I predict that there will be a positive correlation with higher levels of soil pH  being present in the areas of new growth. The response variable should be the presence of undergrowth and the explanatory variable should be soil pH levels the former being a categorical variable and the latter being a continuous variable.

Blog Post 2

The source I chose for this post, “Soil bacterial communities exhibit systematic spatial variation with land form across a commercial potato field”, is an Academic, peer-review research paper. I found this paper online published by ELSEVIER Which is a major publisher for scientific content that uses peer review. The first three people on the paper Neupane, Goyer and Zebarth all have PhDs, and either belong to a university or work for the government of Canada, so I would assume they have the required expertise in the field. The paper includes a bibliography, in-text citations, a methods section and a results section. All these features indicate an academic peer reviewed research paper.

Link to the article:

https://ac.els-cdn.com/S0016706118305056/1-s2.0-S0016706118305056-main.pdf?_tid=67ab562e-2873-4f3e-9ba7-2fd0377f7eba&acdnat=1539814414_c4e67f76788968e2bc11d4858d7ea5e9

Ecology Blog Post 1

Observations of Study Area:

The area I have decided to observe is Art Gibbon’s Memorial Park. Art Gibbon’s Park is a wooded, flattish city park in Nelson BC. The park is rather large around the size of one and a half football fields.  at the top of the Rosemont neighbourhood, a neighbourhood that spreads over the side of a large hill at the top of town. The park is mainly covered by large trees that appear to be Cedar, Hemlock and Douglas Fur for the most par. Under these large trees there seems to be minimal undergrowth present. There are a few patches of smaller, thinner white trees, and where they grow the floor is carpeted in moss and small plants. There were minimal signs of fauna present, the park was quiet with no birds nearby, and only a few glimpses of squirrels off in the distance. I visited the park a few times since the 1st of October at 10:00am, 12:00pm, and 5:00pm, in both cloudy and sunny weather.

Questions:

  1. Is there a difference in soil quality between areas of new growth and area’s with the established canopy?
  2. Are there patterns in the distribution of the different species of trees due to competition?
  3. How does snow fall interception relate to the species of trees

Blog 7

In my research I am looking to determine the distribution and frequency of Pinus banksiana on bedrock substrate versus soil substrate. It has been observed and noted in literature that P.banksiana grows in dry, well drained , sandy or rocky terrain. This is an observation that I have also made of the species in the North. P.banksiana is found amidst the forest canopy with soil substrate as well. There may be many ecological processes at work to determine where Pinus banksiana will grow. I believe variables that underpin the frequency and growth of P.banksiana include soil depth and nutrients. As well as canopy cover and elevation. Not only does P.banksiana appear to grow most abundantly on bedrock, this bedrock is not apart of the boreal canopy and is usually situated at a higher elevation then the rest of the surrounding foliage. Another ecological factor to consider is how P.banksiana reproduces and what conditions these reproductive processes need in order to produce viable offspring.

My keywords : Pinus banksiana , bed rock , distribution