The source of Ecological information that I will write about in this post is an article about Seamounts called, The Ecology of Seamounts: Structure, Function, and Human Impacts.
This article is definitely considered to be academic material as it fulfills the three basic requirements.
The article is written by experts in the field whose credentials are listed under their names. The authors have affiliations with various Universities and other organizations.
The article also includes in-text citations and a list of literature cited at the bottom.
This article has been published in the peer-reviewed academic journal, Annual Review of Marine Science. Every article published in this journal must pass through a peer-review process to become published.
No new research results are presented in this article. There are no methods or results sections in the article as there is no research conducted.
Instead, the article summarizes major findings in the field into a concise overview of the state of research in the field. This article is academic, peer-reviewed review material.
Data collection for my project is ongoing. I am observing if the abundance of snow fleas seen on the surface of the snow changes under open or shaded circumstances. My prediction was that snow flea abundance would increase under shade.
I decided to keep on with the same data collection strategy that I used during my initial data collection venture but to ramp it up with multiple observations/counts over several days. Five 0.5m2 treatment quadrats (located under a shaded structure) and five 0.5m2 control quadrats (fully exposed to the sky), randomly spaced in a section of garden, have been visited 3 times a day since March 19 with the goal to continue this systematic temporal observation process until at least March 23. That will make a total of 15 observations, five at 10:00, five at 13:00, and five at 16:00 over the course of five days, to see if a pattern of snow flea preference to open or covered sites is apparent. So spatially there are five treatment and five control replicates, with data measurements occurring 15 times.
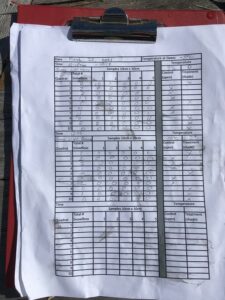
So far, the data collection process is going well. I have created a better data collection sheet (Figure 1) and have streamlined the process of collection so that each each count goes relatively fast. Some of the measures I took to facilitate counting should snow flea numbers be too high to quantify in 0.5m2 quadrats have been seemingly unnecessary – though I continue to divide each quadrat into 10cm x 10cm subsamples and quantify snow flea density inside each.
Even though I believe that my hypothesis is worth investigating, I’m finding that my prediction is a bit off base and that snow flea abundance appears to be greater in the open. Other weather-related factors such as cloud cover, precipitation, wind intensity, and changes in snow quality as a result of the artificial shade may be contributing to observed patterns as well as my original prediction which was based on naturally occurring shade within forests. Snow flea abundance has not been as great during this time as I had hoped, and I plan to keep the study site set up even after these 5 days are over so that I can continue to observe snow flea presence and abundance under open and shaded treatments, especially if their surface numbers explode under the right environmental conditions – factors which are still a mystery to me.
Location: Duck Pond at the Queen Elizabeth Park Disc Golf Course in Vancouver BC
Date and Time: March 20, 2021 11:30
Weather: Overcast, not raining, ground is quite wet because of the overnight rain, around 10 degrees Celsius
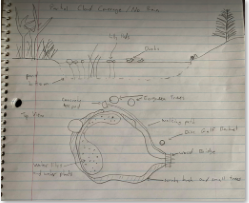
For my project I have selected the duck pond at the disc golf course in Queen Elizabeth park in the heart of Vancouver. Queen Elizabeth is a large city park in the middle of residential Vancouver. The disc golf course is located at the Eastern edge of the park. The final hole of the disc golf course includes a tee shot over one half of the duck pond. The pond and its immediate surrounding area take up a space of around 50 meters by 50 meters. One side of the pond receives high human traffic as there is a walking path that lines the side of the pond for disc golfers to walk from the tee to the basket target. It is also not uncommon for people to wade into the pond on that same side when their discs land in the water. The other side of the pond does not receive the same level of human traffic. scrubby bushes and small trees line this side of the pond. The land surrounding the pond is very flat and covered in moss and grass. A few water lilies and other water plants can be seen surrounding the edge of the pond away from the areas of high human traffic.
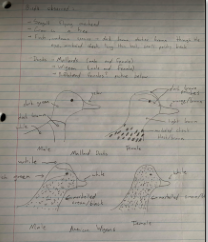
Figure 1. Field Notes. Top of page is a side view of the topography of the pond while the bottom half is a top down view of the pond and the surrounding vegetation.
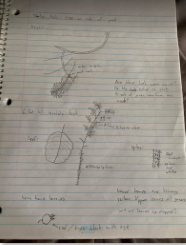
Figure 2. Field notes on vegetation. Rose hip plants appear to be a good study subject.
Figure 3. Field notes on observed birds.
The most notable vegetation includes the scrubby bushes and small deciduous trees lining the pond as well as three large evergreen trees, short moss and grass surrounding the pond area, and water plants in the pond. There were no noticeable signs of mammals in the area but plenty of birds could be seen including seagulls flying overhead, a crow in an evergreen tree, a small finch in the bushes, and mallard ducks, American wigeons, and Bufflehead ducks in the pond. There was also goose feces in the grass surrounding the pond.
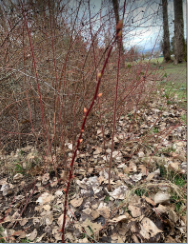
The most likely subject targets were the wild roses growing around the edge of the pond. There are many vertical rose plants consisting of one tall shoot with no branching. These plants ranged from under 50 centimeters to well over 2 meters in height. These plants have many buds forming on the upper portions of the shoots. These buds are likely vegetative buds which will form into leaves or branched shoots. Despite the difference in size, the taller rose plants appeared to have a similar number of buds as the shorter plants. The buds on the taller plants were only located on the upper portion of the shoots leaving the bottom portions bare. The linear nature of these plants make them a good candidate for easily collecting fully objective data.
Figure 4. Close up on wild rose plant buds.
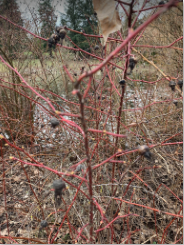
Figure 5. Dead rose hips from the previous year still attached to the plant.
Based off of my initial observations the three study ideas that I have come up with are:
What impact does the level of human traffic have on the species and density of grass and moss?
What impact does water plant density have on the water fowl distribution on the pond?
Is there a correlation between height of wild rose plants and the number of buds forming? Is there an optimal distance range from the tip of the shoot for the buds to form regardless of plant height?
The sampling strategies put a lot into perspective for me. The first strategy of symptomatic sampling was the fastest and seemed to be more accurate than the other sampling strategies, while randomly sampling and subjective sampling took longer and seemed less accurate. Overall, my data suggested it would take 12 hours to gather all this data, which was surprising in general.
Moving onto percentage errors for the two most common species and rarest species was also interesting. Eastern Hemlock and Sweet Birch, the most common species, both had low percentage errors varying from 6% to 15%. When comparing to the Striped Maple and White Pine, both species had percentage errors exceeding 100%. The most accurate sampling strategy for the rare trees and common trees seemed to be random sampling. But overall, for all sampling strategies, the systematic sampling yielded the most accurate results.
I observed that with less species, there was a larger margin for error in sampling, than for the common species. In general, I found I was curious why there are less of Striped Maple and White Pine than the other species of trees.
I was happy to do this research study because reading about peatlands and being out in the field built on the interest and appreciation that I already had for them. I think that this is something I will continue to read up on. I had a hard time landing on a design and hypothesis but when I finalized my idea it was fun to execute.
If I were to do this study topic again I would want to do it in the spring or summer. It was very hard to identify plants in the winter and took much longer than I think it would have if there were flowers present.
Engaging in this study has altered my view of ecological theory development. I think my final study was void of biases but I definitely struggled to design a study that didn’t feed into my preconceived notions. I think developing theories in ecology is interesting because of how complicated the real world application is. There are so many things to account for that could influence what you are observing. I learned about so many more ecological interactions in my study than I noticed in my original observations.
I had a hard time organizing and summarizing my data. I thought that it would be easier to place the information in a table than it was. After looking at it a little more I think that I will try to find a different way to organize it that is easier for the reader. I realized after sending the assignment that the way I organized it (by transect and quadrant) did not rely the information that I wanted it to.
I changed the table by creating three tables to show the mean pH and plant diversity of each transect distance. I also made sure to write down every species that was present. This new format made it easier to see which species were only present at certain distances as well as which distances were more acidic and diverse.
The outcome of the data surprised me. There were several species only present beside the walking path and several that were only present 10-m into the bog. I also expected to see more Sphagnum moss but it was only present in 11/30 quadrants; I wonder if that is because there was disturbance near the path.
The study I am doing seeks to investigate the effect of soil pH on plant diversity in peatlands but it also investigates the connection between soil pH and plant diversity of peatlands to land-use changes. Some of the processes that could be at play in this study are water-logging and soil composition. It could be that the plants that are growing closer to the pathway are not able to grow further into the peatland due to water-logging or soil composition. It might be that the soil that was brought in to build the pathway created a better environment for these specific plants or perhaps the soil that was brought in even carried some viable seeds with it.
The keywords that I would use to summarize my research would be peatland land-use changes, plant diversity and soil pH.
For my data collection I used transects as a sample unit and 1×1 foot quadrants as my subunit. I had 10 replicates of each sample. Each transect was 10 meters apart and each began at the edge of the foot path, followed the gradient down the mound of the hilling and ended in the peatland. The transect was interrupted at 5 m intervals.
I did struggle implementing my design a little because it was harder than I expected to walk that far off the pathway and into the peatland area. I also ran into a little more soil water-logging than I had expected but that may be due to the time of year I took these samples. I used an EXTECH pH Module to take the pH from the centre of each quadrant. It was a little difficult walking through the peatland with all my supplies and taking the pH sample from the centre of each quadrant. Some of the quadrants had large plants in the middle that I had to work around to reach the soil below.
I will be reflecting on the water moisture, pH, and soil composition. I also might think that there is something to be said for how hard it was to walk in there and so how less disturbed it must be by humans overall.
Setting up my study site and collecting my first set of data points was a fairly lengthy process and though it has turned out to be an exciting adventure, it has also been fraught with uncertainty and a bit of the mundane. Let me summarize:
Organism of study: Snow fleas (springtails) in northern BC.
Hypothesis: Snow flea density on the surface of the snow is correlated with the presence or absence of cover/shade.
Prediction: Snow fleas will increase in density when given the opportunity to seek cover or shade in an otherwise open-to-the-sky habitat.
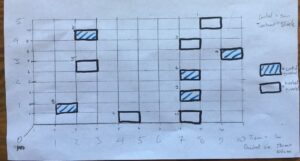
Figure 1. Simple Random study design. x and y coordinates generated at Random.org
Study design: I created a manipulated simple random experiment in which I took a 50m2 plot of open ground in my lower garden (5m x 10m) and divided it into 100 cells that could be randomly chosen to select 10 0.5m x 1.0m quadrats for observation of snow fleas. 5 of the 10 cells would be randomly selected for treatment (with a shade-producing tent placed over top), while the other 5 cells would be my control group (open to the sky).
For independence, I stipulated that no two cells could be adjacent to each other – I did not want the shaded quadrats to affect the unshaded quadrats.
I divided each 0.5m x 1.0m quadrat further into 50 cells in order to randomly select 5 10cm x 10cm samples from which I would count the snow fleas.
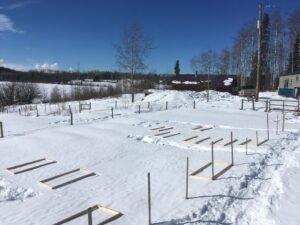
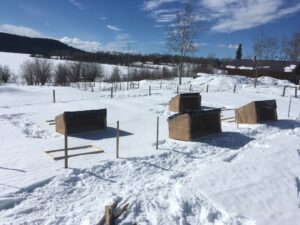
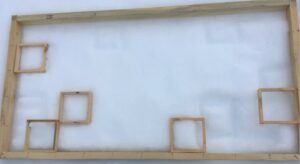
It took a few days of shop-work to create rectangle quadrats, tents and square sample units out of wood (this was the mundane part). When things were finally ready I set everything up outside and waited for the snow fleas to arrive. Figures 2 and 3 show how the site looked upon setup. Figure 4 is an example of one of the quadrats with 5 randomly spaced sample squares in it.
Figure 2. Quadrats in the snow.Figure 3. Covered and uncovered quadrats.Figure 4: One replicate with 5 sample units.
A few difficulties presented themselves:
After I set up my 5 treatment and 5 control replicates, all I needed was to count snow fleas, right? But they were no where to be found! Some winter days they seem to speckle the snow in truly astronomical numbers, and other days they are completely absent. Following my preparation for studying these mysterious organisms, they followed the latter trend – completely absent. The reasons for this, I believe, was that for the three days following my setup (March 9-11) we had morning temperatures of < -10C and daytime temperatures at around 0C. Apparently, they don’t want to rise to the top of the snow if it is too cold.
Cold but sunny days followed the setup of my wooden structures. The wooden quadrats and sample squares started to melt into the the snow, which I had carefully tried to not disturb in any way so as not to introduce confounding variables. The surface of the snow under the shaded coverings also seemed to be forming a different sort of crust than the surfaces left out in the open.
Anxious to get some data collected, on March 11 I went and collected my first round of data, randomly selecting new spots for the sample square placements and counted a total of ONE flea out of 50 sample sites! And it was in one of the sunny quadrats, not the shade like I had predicted! Was it now too late in the year to see snow fleas on top of the snow? Was I going to have to come up with yet another study idea?
The next morning (March 12) I noticed on my way to work that the temperature had barely dropped below the freezing point. Throughout the morning at my place of work, I noticed snow fleas in large numbers hopping all over the snow. I was informed by certain helpers that my study site back at home was alive with snow fleas as well, though interestingly they seemed to be avoiding the shaded sites and were sticking to the sunnier areas. Returning home, I was able to randomly select new sample points and start counting by 15:00, and at last had a data set that I was able to draw some conclusions from – even though the density numbers were not as high as I had envisioned or would have liked. I counted more snow fleas in the control quadrats than in the treatment quadrats.
Was the data I gathered surprising in any way? Yes, frankly. During my initial observations, it seemed like snow fleas were present in higher numbers in the forest and under shade compared with open areas. In my study site, they were present in higher numbers in the control quadrats that had no coverings, and were almost not present at all under the tents that I had erected. Nevertheless, the fact that there was a noticeable difference between treatment and control encourages me to believe this study design might have some statistical significance, and I would probably choose to continue pursuing this approach to data gathering.
That being said, I am also interested in adding another layer to the snow flea study (though this may or may not occur depending on time and scope for the purpose of this course): modifying the snow depth at each quadrat site and eliminating the shade factor, so that the explanatory variable now becomes continuous in nature – snow depth in cm. The response variable would remain the same – density of snow fleas. This interests me because during those times when snow fleas are most abundant, they usually seem to congregate in places of distinct disturbance such as boot-prints. Because they are soil organisms and rise to the snow surface from the soil it would make sense that they exist all throughout the snow column and densities are probably greatest in lower snow-depths.
I am curious if the level of predator activity in an area affects the activity of a mole colony in the same area.
There are preceding works that provide a theoretical basis for my hypothesis. Some propose the use of models such as the Lotka-Volterra Model (Abrams, 2000) to show the relationship between predator and prey. This body of research creates an architecture around how to model predator and prey communities. The intent of my research is to identify if a relationship exists, and possibly what influences there may be on the communities in the WURA. Previous research paper’s such as this allow me with a basis on which to compare and contrast my own methods and results.
The focus of the research is on feral canines and feral felines acting as predators on eastern European moles in a semi urban setting. Some key words specific to my research project would be:
Mole
Canine
Predation
——————————————
References:
Abrams, Peter A. “The Evolution of Predator-Prey Interactions: Theory and Evidence.” Annual Review of Ecology and Systematics, vol. 31, 2000, pp. 79–105. JSTOR, www.jstor.org/stable/221726. Accessed 9 Mar. 2021.