Blog Post 1: Observations

Date: 19-07-21

Time: 5:50-9:17 pm

Location: Iona Beach Regional Park, Richmond, B.C., Canada

Coordinates: 49.2168° N, 123.2049° W

Weather Conditions: 26 degrees Celsius; sunny and clear, occasional cloud; light breeze (SE 17 km/h); relative humidity of about 42%

Topography: coastal sand ecosystem on a peninsula located about 5 km north of YVR international airport and 10 km southeast of the University of British Columbia campus.

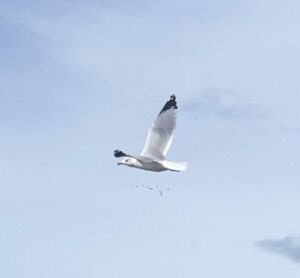
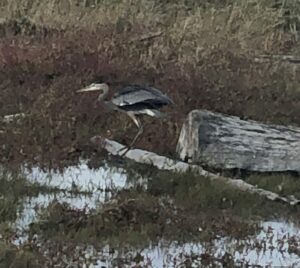
Species: Large-headed Sedge (Carex macrocephala); Dune wildrye (Leymus mollis); Blue heron (Ardea herodias); Bald eagle (Haliaeetus leucocephalus); common sea gull (Larus canus)

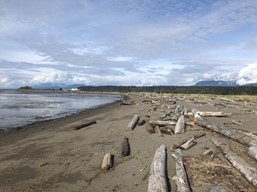
Observations: Upon arrival, the tide had already begun receding from the high of 3.12 m at 2:14 pm towards the low of 1.09 m at 8:29 pm. The beach is composed of sand flats with sparse vegetation and shrubbery, slowly descending into where the Fraser river runoff meets the Pacific ocean (estuary). Iona beach is also located along the Pacific Flyway, thus the diversity of bird species visible here year round is incredible. Many large-headed sedges everywhere. Lots of tracks appearing to be from dogs observed in the sand—possibly coyotes too? Many layers to the vegetation including sand, small vegetation such as sedges and dune wildrye, shrubs, washed up and decomposing drift wood.

common sea gull, Larus canus.
Blue heron, Ardea Herodias.
Large-headed Sedge, Carex macrocephala.
Sand flats of Iona beach, sloping into the estuary where the Fraser river meets the Pacific ocean.

Important Reminders: Bring binoculars next time to observe bird species more closely, and a ruler or tape measure to measure vegetation and animal tracks. Wear close-toed shoes—sedges hurt!

Being interested in the ecology and conservation of both the plant and animal life at this lovely beach, I believe this location would perfectly suit my field project for this course. As I continue to visit, I will take more detailed observations and measurements of the surrounding vegetation to understand how the gradient changes from the upper shrubbery and dune wildrye to the lower algae and estuary species found nearer the water. I look forward to working on this project and gaining a deeper knowledge of the natural history and ecology of this beach.

Blog Post 9: Field Research Reflections

As mentioned in previous posts, I initially had a challenging time executing my research design, as my study site was washed out due to flooding. I found another site which ended up being a better selection, as my study object, polypore fungi, were far more numerous than at the original location. The process of collecting samples and studying the substrates was a very enjoyable experience, minus the unbelievable amount of bugs. (I feel for any ecologists conducting field work in northern Canada in the summer).

The correlation between my variables (quantity of bracket fungi and soil moisture) was weak based on the data I collected which was frustrating. I think all ecologists hope to discover a satisfyingly strong connection between their predictor and response variables, and I am no exception! This experience has taught me a lot about the challenges of conducting field research, and the necessity for rigorously assessing and accounting for a wide range of confounding variables. It was somewhat naive of  me to think that a correlation would be found simply by counting bracket quantity per tree and measuring the soil at the tree base. I see now that many other factors need to be considered in a multivariate analysis and that a much larger sample size should be collected for such a study.  Such a study would also benefit from being repeated over multiple seasons and years to assess for changes in polypore growth and soil moisture potentials.

This experience has given me a new appreciation for the complexities and frustrations of ecological research, as the nebulous interactions of biotic variables make ecology less straightforward than other scientific disciplines. Developing an ecological theory is a daunting task because it is very difficult to make any definitive conclusions when endless variables need to be considered and generalities cannot necessarily be made from one region to another.

Blog Post 7: Theoretical Perspectives (Robyn Reudink)

For my research project I studied the growth rate of sunflower plants based on two different watering regimes, including: a high-water and a low-water treatment group. In the high-water volume application treatment, the plants received a total of four times the amount of water, then the low-water treatment group. The sunflowers were grown over a 40-day period and weekly measurements of the shoot height and the maximum basal diameter (mm) were collected for each plant. My hypothesis is that the growth rate of the sunflower plants, measured by the shoot height and the maximum basal diameter, will be influenced by the water availability/ treatment. My prediction is that the average size of the sunflower plants (Helianthus annuus) will be smaller in the low-water volume treatment group when compared to the high-water volume treatment group. The ecological process that relates to my research is the influence of water levels (or water stress) and their relationship to measures of plant growth.

Keywords: plant growth, water stress, soil moisture

Blog post 4: Sampling Strategies

  • The technique with the fastest estimated sampling time was the systematic sampling technique which took 12 hours and 35 minutes for 25 samples. However, the random sampling method did not significantly differ in its time frame when compared to the systematic sampling technique. The difference between the systematic and random methods was 9 minutes.


  • Systematic sampling method:


Two most common species:


Eastern Hemlock ® (564.0-469.9)/469.9 * 100 = 20.0%


Sweet Birch® (52.0-117.5)/117.5 * 100 = 55.7%


Two least common species


Striped Maple® (16.0-17.5)/17.5 * 100 = 8.6%


White Pine® (12.0-8.4)/8.4 * 100 = 42.3%


  • Random sampling method


Two most common species:

Eastern Hemlock® (433.3-469.9)/469.9 * 100 = 7.8%


Sweet Birch® (87.5-117.5)/117.5 * 100 = 25.5%


Two least common species

Striped Maple® (20.8-17.5)/17.5 * 100 = 18.6%


White Pine® (25.0-8.4)/8.4 * 100 = 197.6%


  • Haphazard method


Two most common species:


Eastern Hemlock® (492.0-469.9)/469.9 * 100 = 4.7%


Sweet Birch® (64.0-117.5)/117.5 * 100 = 45.5%


Two least common species

Striped Maple® (16.0-17.5)/17.5 * 100 = 8.6%


White Pine® (12.0-8.4)/8.4 * 100 = 42.3%


  • The accuracy did change with species abundance. The accuracy decreases as the abundance of a species decreases.


  • The most rare species identified as the “White Pine” had a percentage error difference of 42.3% for both the systematic and haphazard method ruling the random method with a percentage difference of 197.6% as the least accurate method. Since the systematic method is the least time-consuming method it is considered overall the best and most accurate method to use.


Blog post 3: Ongoing Field Observations

  1. Identify the organism or biological attribute that you plan to study.


The study I am conducting will focus on the abundance of Boxelder Maple tree species and the relationship between their increase in abundance as the distance towards the riverbank decreases.


  1. Use your field journal to document observations of your organism or biological attribute along an environmental gradient. Choose at least three locations along the gradient and observe and record any changes in the distribution, abundance, or character of your object of study.


Locations for study


  • Location one: “Riparian Area”

This are is located N/E using the parking lot as a reference point. It is a riparian area along the riverbank of the Red River with a sidewalk on the outskirts measured at 353.18 m. There is a very high abundance of Boxelder Maple trees beside the sidewalk and as I walked my way towards the river I noticed a few other tree species with low abundance such as Buroak and Arborvitae tree. Alongside the riverbank, there also seemed to be a high abundance of Boxelder Maple trees.


  • Location 2: “mini-forest”

I chose this area since it is the furthest area away from the Red River lake. I saw some White Spruce trees, a high abundance of Jack Pine trees, a low density of Boxelder Maple trees.


  • Location 3: “Forest next to River” but further away from the Riverbank when compared to location 1

As I walked from the off-leash dog area towards the direction of the river, there was a high abundance of White Spruce trees, some White Willow trees and as I got closer to the river there was an increased abundance of Boxelder Maple trees.


  1. Think about underlying processes that may cause any patterns that you have observed. Postulate one hypothesis and make one formal prediction based on that hypothesis. Your hypothesis may include the environmental gradient; however, if you come up with a hypothesis that you want to pursue within one part of the gradient or one site, that is acceptable as well.


Boxelder Maple trees dominate the area near the river. There are many reasons that can cause boxelder Maple trees to dominate the area near the river. One potential reason could be that it could be a natural area and since it is distant from other tree species such as Jack Pine trees it could have not been disturbed. In other areas of the park, Jack Pine trees dominate the area which could mean that it is an invasive species. Another potential reason could be their need for water. Boxelder Maple trees might require a higher amount of water in order to survive which is why they are found near the river and since trees have deep roots, they could be using the river as an additional source of water. The soil near the riverbank is the same level of dryness; therefore, soil moisture is not likely to be a potential reason for their abundance.


Hypothesis: Boxelder Maple trees is higher in abundance in areas near the river than areas further away from the river.


Prediction:

Boxelder Maple trees are more likely to be found in areas near the river than areas further away from the river.

Boxelder Maple trees require a higher concentration of water in order to survive.


  1. Based on your hypothesis and prediction, list one potential response variable and one potential explanatory variable and whether they would be categorical or continuous. Use the experimental design tutorial to help you with this.


Response Variable: Abundance of Boxelder Maple trees (Continuous measure).


Explanatory Variable: Distance from the Red River lake (Continuous measure).


Since both variables are continuous, this suggests that this study would require regression analysis for its experimental design.


Blog Post 6: Data Collection (Robyn Reudink)

My field data was collected on a weekly basis over a four-week timeframe from June 13th to July 4th 2021. This included measuring both the plant shoot height and the maximum basal diameter (mm) for each sunflower plant. There was a total of 12 sunflower plant replicates for each of the 2 study groups/ treatment levels. I didn’t encounter any problems implementing my sampling design.

During the field data collection (including on June 13, 20, 27 and July 4) sunflower plants H1, H2, and H3 were observed to be the smallest (both in shoot height and maximum basal diameter) of the plants grown in the high-water volume study group (note: sunflower plants H1, H2 and H3 were all grown/ located within the same pot). The exact reason for this pattern is unknown, however, it may be due to variation in the microsite and/ or microclimate at this specific plant-pot location. All of the other sunflower plant replicates that were grown in the high-water volume study group (H4-H12) were noted to be larger (both in shoot height and maximum basal diameter) than the sunflower plants grown in the low-water volume application study group (L1-L12).

Blog Post 5: Design Reflections (Robyn Reudink)

The data I have collected for my experiment includes measuring each of the sunflower plants shoot height and the maximum basal diameter (mm). The systematic sampling strategy that I used allows for easy data collection and I plan to continue to use this approach. However, my three-sunflower plant/ sampling units that are located in each of the pots do not have enough distance between each other to be considered independent from one another. It would have been better if I had used individual plant pots for each of the sunflower plant replicates, so that they are considered independent from one another.

Blog Post 7: Theoretical Perspectives

For my research project, I observed how the presence of dogs might impact the time an American Robins (Turdus migratorius) spends foraging at Derby Reach Regional Park in Langley, BC. I observed the foraging time at two locations: in the dog park and the nearby meadow. I hypothesize that the amount of time a Robin spends foraging in the meadow will differ from the dog park. I predict that the length of time a Robin spends foraging in the meadow will be greater than in the dog park due to the greater number of dogs present in the dog park than in the meadow. The ecological process reflected from the study focuses on community ecology and the interactions between species.

Keywords: American Robins, dogs, foraging, and parklands. 

Blog Post 6: Data Collection

The hypothesis for my research project is the length of time an American Robin (Turdus migratorius) spends foraging in the meadow will differ from in the dog park. For my field data collection, I used the Pont Count method to monitor the length of time at least one Robin spent foraging in the meadow and the dog park. Ten replicates were carried out over ten days. For each replicate, I visited the meadow and dog park for 30 minutes each while alternating each day which location was visited first, and the field visits were conducted during the hours of 5:00-7:00 PM. The data collection strategy was relatively simple. Sitting quietly at a picnic bench with binoculars and a stopwatch, I recorded the time when at least one Robin present or absent in the meadow or dog park. 


Considering the time of day, I was surprised by the number of Robins actively foraging and how easily they would return to each location once the area was vacant of dogs. It was also interesting to observe the behaviour between the Robins as one Robin appeared to be territorial over one particular tree and would chase any other Robins that would come near. Ultimately, it was interesting to see that the time a Robin spent foraging in the dog park was relatively close to the time spent foraging in the meadow.

Blog Post 9 – Field Research Reflections

I had to change field experiments halfway through the project, which caused many problems. Originally, I was looking at the relationship between moss and cedar trees (Thuja plicata) but they didn’t have a strong enough correlation. This study would have been considering seedling establishment so I chose to go with a categorical response variable for the cedar trees, with the logic that if no seedlings establish, then there will be no trees on the site. When I changed the field experiment to the relationship between soil moisture and cedar trees, I already had the data on the cedar trees and didn’t have time to restart. If I were to do this project again, I would choose a continuous response variable, such as density or productivity (most likely density, as it is easier to measure). This change in design would improve the study by not having to use logistic regression and having more data to work with. 

Another issue I had with the design was that I didn’t have the tools to dig as far down as I would have liked to get the soil samples. My small shovel wasn’t very good for getting past large rocks or in some cases, I barely could dig at all as the bedrock was so close to the surface. I had to change my design so that I only dug down 10 cm deep or until I hit bedrock. If I were to do this study again, I would get some tools to be able to take samples at 2 meters deep as well as at the surface, to account for the tree’s root system. 

Engaging in ecology has certainly changed how I think about ecological theory and its development. There are so many variables that contribute to ecosystems, such as inter and intraspecific interactions, resource availability and disturbances. It is difficult to decide which factors are the most relevant for a study because one definitely does not have the time or resources to consider them all! Although developing theory is difficult in all sciences, I feel like these extra variables and the difficulties in an uncontrolled environment make developing theory in ecology even harder.