As I am compiling my data, I have gained more understanding of what may cause ants to be in higher concentrations in certain areas. One theoretical perspective that fits with my project is how vegetation disturbance affects ant abundance. The disturbance in my study includes complete removal of the weeds and mowing. Another one that fits my project is how does the lack of vegetation, or patchiness affect ants. Given the lack of vegetation in part of my yard and the abundance in the other part of my yard it would be possible to compare the amount of ants in both. Furthermore, how vegetation type affects ants would also fit my project given that part of my yard is grass and the other part is weedy.
Key terms that summarize my research are: vegetative patchiness, arthropod abundance, and disturbance.
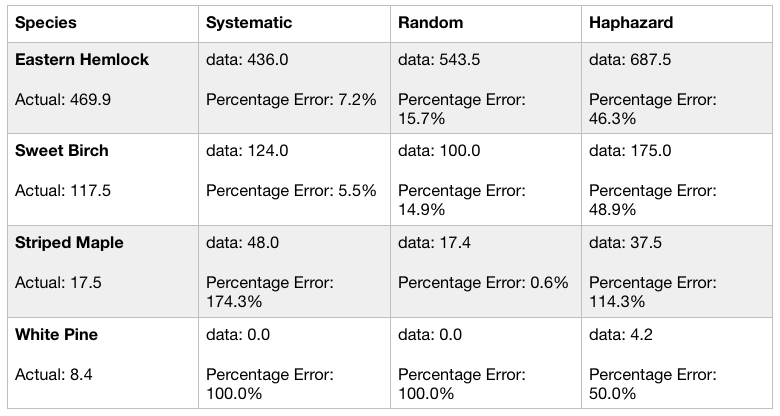
Using the area-based sampling, these are my results from the visual forest tutorial:
Based on my results, all three sampling techniques took about the same time, but the random sampling was slightly faster at 12 hours and 15 minutes.The two most common species were the Eastern Hemlock and the Sweet Birch. Systematic sampling yielded the lowest percentage error for these species. The two least common species were the Striped Maple and the White Pine. As you can see, the percentage errors were extremely high for the Striped Maple using the systematic and haphazard sampling techniques and very low using random sampling. For the White Pine, all the sampling techniques yielded high percentage errors but haphazard sampling was the lowest at 50%. The accuracy seemed to be greater with the more abundant species as the percentage errors were lower compared to the less abundant species. Based off my results, I cannot say that one sampling strategy was more accurate than the others, as the results were varying. I would need a larger sample size in order to obtain more accurate results.
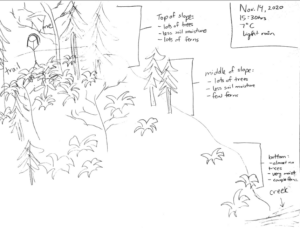
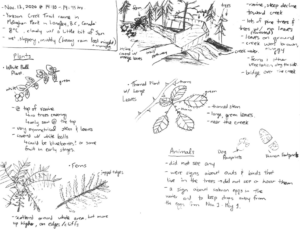
I visited the ravine again on November 14th at around 15:30 hrs. It was a cloudy day again with some light rain and a temperature of 7°C. I decided to focus my observations on the ferns this time and also chose the slope as my environmental gradient. From my research, I was able to identify the species of ferns as Polystichum munitum, or the western sword fern. I also took a different route at the top of the ravine to get a different view and to see if I still noticed the pattern of the ferns being more abundant higher up and away from the creek.
At some points along the trail, there was not a noticeable difference in the abundance along the slope. However, at many areas, I could see that were many more ferns at the top compared to the bottom. I was able to confirm the pattern I saw last time. I stopped at one point along the trail and chose three locations on the slope to study the ferns: at the bottom right by the creek, halfway up the slope, and then near the top of the slope.
Bottom of slope: very moist soil, not many trees, only 3 ferns
Middle of slope: soil a little less moist than bottom, lots of trees, maybe 5-7 ferns
Top of slope: soil a little moist, lots of trees, lots of ferns
There could be many possible reasons to explain this pattern including, soil moisture or water content and sunlight exposure. I know ferns tend to grow in damp, shaded areas, so moisture and sunlight exposure are definitely factors that I can explore as possible reasons for my hypothesis.
Based on my observations I have come up with a hypothesis, prediction, response variable, and explanatory variable.
Hypothesis: Creek proximity affects Polystichum munitum abundance.
Prediction: As distance from the creek increases, Polystichum munitum abundance increases.
Response Variable: Fern abundance (continuous)
Explanatory Variable: Distance from the creek (continuous)
Field journal entry from my visit showing the fern distribution along the slope
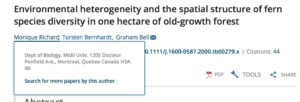
b) This source of information is academic peer-reviewed research.
c) I was able to determine that it is an academic source because I was able to click on the authors and see that they are affiliated with a university. There were also in-text citations and a bibliography.
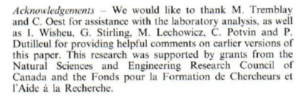
Next, I could see that it was peer-reviewed because there was an acceptance date, as well as the authors thanked some people in the acknowledgements section for “providing helpful comments on earlier versions of this paper.”
Finally, I concluded that it was a research source due to the presence of a methods and results section, meaning they reported results of a field study.
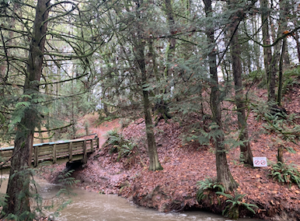
The site I have selected for my project is a ravine in the Yorkson Creek Trail of McClughan Park in Langley, B.C., Canada. It is located behind an elementary school and there is a bridge that crosses over the creek. It is quite a popular trail for people to take their dogs on walks. I visited the ravine on Friday November 13, 2020 at about 14:10-14:45 hours. It was a cloudy day with a temperature of 8°C. There was heavy rain in the morning so the ground was quite muddy and slippery. There is a steep slope heading down towards the creek and bridge. It is a heavily forested area with lots of pine trees and also at this time of year, bare trees whose leaves are scattered throughout the forest floor. The creek water was muggy and running quite fast.
The area is home to many birds, animals, and fish, but I was not able to spot any during my visit. I decided to focus my observations on vegetation. The first plant that stood out to me was at the entrance of the trail, at the top of the ravine. They were some plants with white balls at the ends. I thought it must be some type of fruit in its early stages. Upon further research, I found they were snowberry plants. They were not covered by any trees and interestingly, I only found these plants at the top. This leads me to believe that snowberries need direct sunlight in order to grow. Ferns also caught my eye. They seemed to be scattered randomly throughout the entire area, but after taking a deeper look, I noticed they seemed more abundant around tree trunks and also further away from the creek. The last plant I observed had a thick, thorned stem with large green leaves. It seemed like they grew only near the water, as I did not spot them anywhere else.
The three questions that came to mind during my visit were:
Do snowberries need direct sunlight or are they able to grow under shade as well?
Do ferns grow primarily under shade? Do they grow in moist environments, but not too close to water?
Do the large green plants require lots of water to grow?
I would love to study the snowberries, but I think I would like to conduct my research along the elevation gradient of the slope and because the snowberries were only located at the top, they may not be a great topic for my project. Instead, the ferns seem more feasible, so I will focus my observations on the ferns on my next visit.
Scan of field journalView of creek and slope from the bridge
This was my first field research project that I ever did for a course, it definitely had its challenges in the beginning. It took me some time to decide what I wanted to do my research project on and the location had to be easily accessible to. Once I had decided on what I wanted to do my research project on, data collection was good, even though I had to figure out how I was gonna do my replication. I did have to make changes to my design because my response variable was continuous and I realized that after collecting quite a bit of data. After I changed my design, then my data collection changed a little. But I did collect enough data for my project.
Engaging in the practice of ecology has definitely increased by appreciation for how ecological theory is developed. It is definitely time consuming and needs a lot of dedication and showed me that ecology is a vast field which increased my appreciation for it.
Based on my data, I decided to do column graphs because they portrayed the data well. I did have some difficulty in deciding what to show on my graphs because I had a lot of data. I did 3 column graphs which were supporting my hypothesis- that there are more geese around ponds than along the river. One graph shows the total number of geese in these areas and the other two graphs show the density of geese at the two different times that I collected the data which were 12pm and 5:30pm at both locations. These graphs supported my hypothesis and contrasted the difference in the number of geese at the locations.
The data did not reveal anything unexpected because it supported my hypothesis. Even though I collected the temperature twice a day, I did not use it in the graphs because the temperature did not seem to affect the density of geese at the locations. I decided to do a table as well, showing the average and standard deviation of the geese density at both the locations, during both the times that I collected the data. This also supported my hypothesis and the graphs.
My field collection consists of 12 total replicates, 6 in each subarea of my yard. Each replicate is a quadrat that measures .5*.5m. I randomly placed them in my tard using a random number generator. I decided not to use the garden as it was too small to have more than one replicate it in it. If I put more than one the results would have been skewed due to the disproportionate replicates compared to size. The extreme changes in weather continues to be challenging to my collection activities and I worry that if I do not try and go out on days when weather is similar that my results will be skewed. I tried going out multiple times a day to get more accurate results, but I found that going out once a day in mid afternoon when the weather was at its most stable worked better.
I think that my results will be reliable given the fact that my yard usage has not changed much in the time I have lived here. This consistency will reduce the amount of interference in my data collection.
After completing my replicates research from my study site, I have come to find a better understanding of what possible theories could parallel my project. The topic that seems to fit most aptly relates to anthropogenic disturbances. These are disturbances that are caused by human activity, which result in smaller-scale ecological changes. From what I can gather through my research so far, it is indicative that the Western Honeybee pollination activity is being affected by anthropogenic habitats (the adjacent road). The combination of noise pollution and higher human activity could be the cause of the decreased Honeybee activity closer to the road. Because the honeybee activity decreases as you get closer to the road, a disturbance gradient would best define this phenomenon. My initial hypothesis touches on this topic, and I hope to see more research to further solidify the answer to my project’s question.
Keywords to summarize my research includes the following: anthropogenic disturbances, honeybee pollination and disturbance gradient.
The theoretical basis of my research project is to determine why the geese prefer a particular type of waterbody and grassland over another. The underlying factors that underpin my research of the geese density are- disturbance, weather and the vegetation. The geese prefer the vegetation around the ponds which had common groundsel and common plantain, the soil moisture seemed to support their growth more. There were a lot more trails along the river which had more human activity. And the vegetation was more of grasses and coniferous trees which support other wildlife. This might be the reason why the geese prefer to raise their young and stay around the ponds. It would be safer and more food resources for them. My research keywords will be- Geese Density, Grassland Vegetation and Waterbody.