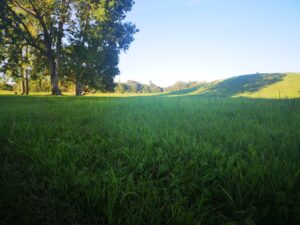
Blog Post 3- Ongoing Field Observations

Designation: City Park, Community Garden
Time: 1647 hours
Date: 08-09-2020
Weather: Sunny, clear sky, hot and dry, minimal breeze 25 degrees celsius, hazy (Forest Fires in Effect In Washington DC)
Seasonality: Summer, approaching fall
Study Area: Community Garden at 1645 East 8th Avenue Vancouver BC. Latitude: 49.2635 Longitude: -123.0711. Study area is generally small, approximately 2 houses worth of lans (~1500 sq. feet)

The organism I plan to study is the Western Honeybee (Apis mellifera)
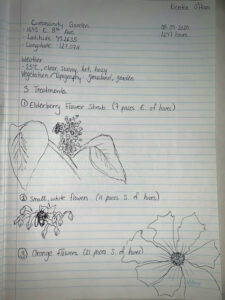
As briefly outlined in my field journal, I have chosen 3 locations along my environmental gradient (between the bee hive and street located about 25 paces South from the hive. For the sake of ease I have labelled the areas by the plant that I am observing the honeybees on there:

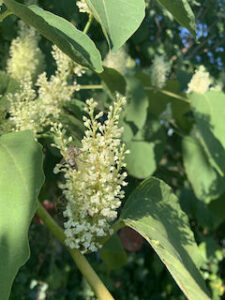
Location 1: Elderberry Flower Shrub (7 paces East of hive)
-Character: Bees seem to be busier, more movement observed in the bees between each small flower on the plant.
-Distribution: Bees are pollinating moderately closely together, seem to pollinate the flower bunches that are in direct sunlight. Not every flower bunch contains bees, out of 1 shrub approximately 3-6 flower bunches contained pollinating bees.
-Abundance: 5-7 bees pollinating on one flower bunch at any given time

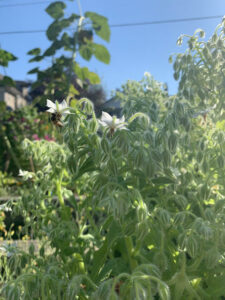
Location 2: Small white flowers (11 paces South of Bee hive, towards street)
-Character: Bees are still pollinating here, don’t seem to move as quickly (perhaps this is just because I do not see as many bees in this location, giving the illusion that they are moving slower)
-Distribution: Bees are pollinating further apart than location 1, can count 3-4 flowers in between flowers that contain a bee pollinating it. the entire plant is in direct sunlight, no shaded areas to observe the difference of bee activity.
-Abundance: 3-7 bees on entire plant at any given moment

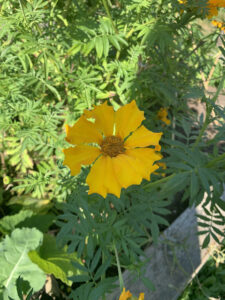
Location 3: Orange Flowers (21 paces south of bee hive, closest location to the street out of locations observed)
-Character: Bees still pollinating here, seem to be more “picky”, going from flower to flower until they choose one to pollinate. Seem to be moving as quick as they do in location 2
-Distribution: Bees pollinating far away from each other. The whole plant contains approximately 10-15 flowers and only 1-3 bees will be on the entire plant
-Abundance: 1-3 bees on entire plant at any given moment

3. After thinking about possible underlying processes that may cause the patterns observed I have come up with a hypothesis and prediction:

Hypothesis: Roads influence Honeybee pollination patterns

Prediction: I predict that Western Honeybees pollinate plants that are located furthest away from the street.

4. Based on my hypothesis and prediction, I have written one potential response variable and one potential explanatory variable:
-Response variable: Western Honeybee Activity. This would be a continuous variable as I can use numerical units to count the numbers of honeybees over a period of time that visit the site.
-Predictor/Explanatory variable: Distance from the street (East 8th Avenue, Vancouver BC). This would be a categorical variable.

Because my predictor variable is categorical and my response variable is continuous, this would be indicative of an ANOVA design. I hope to use a one-way layout design to compare the pollination activity of my 3 treatments.


Blog Post 4: Sampling Strategies

Virtual Forest Tutorial: Snyder- Middleswarth Natural Area.


Results of Sampling Technique Tutorial
Sampling Technique Systematic Random Haphazard
Common Species Actual Density (T) Estimated Density (E) Percentage Error % Estimated Density (E) Percentage Error % Estimated Density (E) Percentage Error %
Eastern Hemlock 469.9 460 2 304.2 35 375 20
Sweet Birch 117.5 124 6 100 15 137.5 17
Yellow Birch 108.9 68 38 129.2 19 95.8 12
Chestnut Oak 87.5 100 14 108.3 24 75 14
Red Maple 118.9 124 4 179.2 51 91.7 23
Rare Species
Striped Maple 17.5 16 9 0 100 20.8 19
White Pine 8.4 0 100 20.8 148 8.3 1


Time Spent Sampling:

Of the three sampling strategies, systematic, random, and haphazard, they were all very similar in the amount of time spent sampling, with haphazard being slower than the other two by 2 minutes.

Accuracy of each Method of Sampling:

The most accurate sampling method for the more common tree species was the systematic sampling method.  The most accurate sampling method for the rare species, Striped Maple and White Pine was the haphazard method. The accuracy for the systematic and random method declined for the rare species compared to common, due to the fact that they missed one rare species all together each. Whereas the haphazard method stayed about the same for both common and rare species. Perhaps with more sample points and another location for systematic would have been more accurate.

Blog Post 3: Ongoing Field Observations

The organism that I plan to study is the Trembling Aspen Populus tremuloides , found in a pure stand on the west side of my study area. The Aspen tree is found throughout the province of BC and grows best in moist, well-drained soils. It produces root suckers that grow into clones that become a colony over time(British Columbia, n.d.). The Trembling Aspen prefers to grow in full sun as it is intolerant of shade.

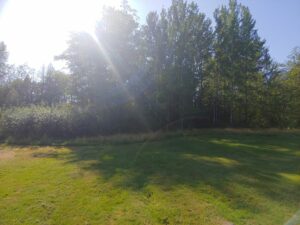
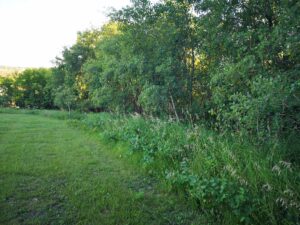
My study area is an open field in a Regional Park that is surrounded by forest. These Aspen trees are comprised of a pure stand that is of mixed age and are located in a small area approximately 150m by 200m in size. There are a variety of different diameter sizes and height differences in the stand of trees, the larger of them are further west, deeper into the forested area, whereas the smaller trees are found closer to the open field. The soil was compact throughout the stand but was drier at the north end and moist at the south end. It appeared that there was a higher density of smaller diameter trees at the south end, closest to the open field.

Since the Trembling Aspen is shade intolerant, the new suckers and clones will likely survive best if they grow in the full sun, closer to the open field then under the dense forest canopy. Also, since the soil appeared to be more moisture on the south end, perhaps this is also a limiting factor to new tree growth.  I predict that within the Trembling Aspen stand there will be a gradient,  a higher abundance of younger trees (smaller trunk diameter) closer to the field and south and lower  (larger diameter) as I move inward to the forest and north.

The response variable is the size / age of the Aspen trees (diameter of trunk) and the explanatory variable would be the availability of sunlight and soil moisture. Both the response and explanatory variables would be continuous.

Blog Post 9: Field Research Reflections

My field project took a while to jump start, I had to change my subject of interest and location due to the unforeseeable weather changes in the prairies. First we had flooding (dikes were built and flood evacuations were issued), and any area near the river was closed off for almost two months. Followed by crazy wind storms, and tornado’s touching down – so again a new location was needed to carry out my research. So in summary, I had many changes to the design before actually implementing the final one.

Once if was formed, and after data collection was finished no other issues came up – which is really nice.

Engaging in the practice has altered my appreciation for how ecological theory is developed. I think that ecology observation studies require a lot of patience, time, and the ability to adapt with changing conditions – as nature is constantly changing.

This was a wonderful course, and I really enjoyed stepping out of my usual biological study stream. Ecology was refreshing and the topics very fascinating and applicable to everyday life.

Blop Post 7: Theoretical Perspective

Seasonality, weather, and type of topographical vegetation are contributing factors to white-tailed deer activity and movement. However, the prairie ecosystem of North America is vast in area, so activity and movement  varies within regions. To effectively manage and track white-tailed deer populations, region-specific empirical information such as which kind of vegetation coverage has higher white-tailed deer activity during a specific season needs to be collected.

Keywords:  white-tail deer, vegetation coverage, activity

Post 9: Field Research Reflections

My study design remained quite consistent throughout the course of the research project. My understanding of experimental design, however, did develop substantially. Early on I decided that i would divide my sample plots into elevation zones that correlated with the environmental gradient, which I hypothesised would respond to elevation from the lake shore. In doing so, I realised the purpose and importance of subplots in field experiments, as they allowed me to accurately analyse data from the seperate sample plots — by comparing data sampled from the same elevation zones in the different plots. As my hypothesis developed I also became aware of the influence of substrate on my response variable (species composition), which would make it difficult to determine the extent to which my predictor variable (elevation/flood frequency) affected it. However, as my research progressed I realised that that substrate is also very much influenced by flood frequency, and thus is closely tied to my predictor variable. For this reason I included substrate descriptions in my sampling, and took it into consideration in my analysis of the results.


Blog Post 8: Tables & Graphs

I had some issues with aggregating my data as this is my first time working with scat as a response variable. First, I had to figure out how to quantify the average of all replicates collected for the response variable. I decided to divide the total number scat (one scat being defined as one pile of white-tail deer droppings) for each terrain type by the total number of replicates (i.e. quadrats). Thereby, I was calculating the average scat amount per quadrat (1m2) for each terrain.

The outcome was as I expected, with a higher average of scat per 1m2 for the open-grass area. However, the difference between the two areas was not as large as I first predicted. I need to conduct statistical analysis to determine if the difference was significant.

Blog Post 6: Data Collection

I collected my field data August 23, 2020. I collected 12 replicates for the dense forest area and 12 replicates for the open grass area. The only problem I have faced in implementing my sampling design is that in the past week it has been very windy and on August 17th two small tornado’s touched ground 20 minutes away from the zone of observation.

I have no problems implementing sampling design.

I have noticed an ancillary pattern that has caused me reflect positively on my hypothesis. I have noticed that deer activity has decreased the past week due to the wind storms, so less scat is found in both areas. However, the original pattern that more scat is present in open grass area is still present.

Blog Post 5: Design Reflections

My initial data collection day went as planned with implementation of my sampling strategy going quite smoothly. I came across one minor difficulty in that my home-made quadrat from cardboard, although useful, started to lose durability towards the end of the sampling intake due to the ground being moist/wet. As I took 10 samples in total, and my research project requires 20 samples in total, I will need to re-make the quadrat with cardboard and wrap it in plastic, or use a more durable material.

The data results were in support of my initial hypothesis prediction, however, I was surprising in that most quadrats did not have any presence of scat for both areas. I plan on collecting data using the same technique as it was quick, easy, good randomization, and allowed for easy visualization of any scat that was present in the quadrat.

Blog Post 3: Ongoing Field Observations

During my observations on the field – not only on the first day of observation but numerous visits at different times of the day, the difference in animal activity between the two distinct areas fascinated me, especially with deer activity.

July 14th:

  • Time: 6am – 6:30am (dawn)
  • Temperature: 20C
  • Weather: Sunny but partly cloudy. Humidity was 68% (quite high). Wind was ~22 km/hr.
  • Seasonality: Mid-Summer

The number and frequency of whitetail deer seemed to increase the further away from the forest and into the hilly grass terrain. The forest seemed to have a lusher vegetation, a source of water from the creek, and soft earth to frolic. Yet, the whitetail deer seemed to prefer frolicking in the ecotone between the two terrains and preferring to spend their time in the hilly area.  The ecotone had taller grass with a variety of tall grass species, while the hilly area had shorter grass.

Seeing as how deer are animals that move, it is impossible to log their movement 24/7. I decided to track deer activity based on findings of deer excrement (scat).

My hypothesis for this study will be that between two distinct domains (hilly area and forest), whitetail deer activity will be higher in the open, big, grassy area. My prediction for this research is based on observation of live whitetail deer in that area, and the possible underlying processes, such as:

  • The soil and grass type that grows on the hilly area provides a richer nutrient pallet for the deer so they prefer to feed from this area. With a greater surface area than the hilly area has higher abundance as a food source
  • The open-area of the hilly area allows for better visualization of any approaching predators

Hence, why there might be more deer activity in the hilly area compared to the densely forested area. My prediction for this research is that more deer scat, that will indirectly measure deer activity, will be found in the open hilly area. I am choosing to assume that distance away from the ecotone that divides these two terrains will not play a factor, hence deer activity should be equal from the edge to the middle of each terrain.

The hypothesis for my research study will be evaluated by the effect of the predictor variables (two habitats based on different spatial arrangements: Hilly grass area & Dense Forest area) on the response variable (if scat is present in quadrat & number of piles of deer scat present in each quadrat). By gathering data on these two variables with numerous repeats and samplings, I am hoping I will be able to determine within which terrain are whitetail deer more active. Considering that both the response and predictor variable are categorical I will use a tabular (two-way contingency table) design with equal-sized quadrats for my design.


Border dividing the 2 areas of interest
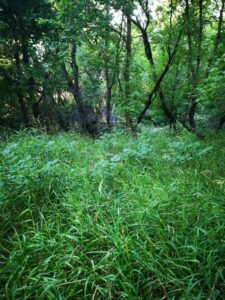
Forest Area

Hilly open grass area