Blog Post 4: Sampling Strategies

In the Virtual Forest tutorial, using Distance-based sampling methods:

Table 1. Comparison of three distance-based sampling strategies; actual, random, and haphazard used to calculate the abundance of seven tree species (Eastern Hemlock, Sweet Birch, Yellow Birch, Chestnut Oak, Red Maple, Striped Maple, and White Pine) in the Snyder- Middleswarth Natural Area.

Tree Species
Strategies Eastern Hemlock Sweet

Birch

Yellow

Birch

Chestnut

Oak

Red

Maple

Striped

Maple

White Pine Est. Time to sample
Actual 469.9 117.5 108.9 87.5 118.9 17.5 8.4
Systematic 277.3 109.6 70.9 38.7 90.3 45.1 12.9 4hr 18min
% error 40.99 6.72 34.89 55.77 24.05 157.71 53.57
Random 441.8 144.1 105.6 115.2 86.4 28.8 0.0 4hr 40min
% error 5.98 22.64 3.03 31.66 27.33 64.57 100
Haphazard 485.0 121.2 83.9 93.3 74.6 18.7 18.7 4hr 38 min
% error 3.21 3.15 22.96 6.63 37.26 6.86 122.6

Based on findings from Table 1:


Which technique had the fastest estimated sampling time?

The times between the 3 sampling strategies were somewhat similar, with the fastest strategy by ~20 minutes being the systematic approach in regards to sampling 24 plots.

Comparing the % error of the different strategies for the two most common and two rarest species. For each species the most accurate strategy was as follows:

  • Eastern Hemlock (most common species) most accurate strategy:   Haphazard 
    • It surpasses the random strategy with an % error of 3.21.
    • Than random & haphazard strategies were more accurate than the systematic, as the systematic had an % error of 40.99.
  • Red Maple (second most abundant species) most accurate strategy: Systematic 
    • This strategy had a 24.05% error.
  • White Pine (rarest species) most accurate strategy: Systematic .
    • Even though it had a 53.57% error, it is far more accurate than the random & haphazard strategies with % errors of 100, and 122.6, respectively.
  • Striped Maple (second least abundant species) most accurate strategy: Haphazard.
    • This strategy had a 6.86 % error which is very low, especially when compared to 64.57% and 157.71% errors for Random and Systematic, respectively.

Did the accuracy change with species abundance?

When comparing all three strategies regardless of tree species, accuracy decreased as species abundance lowered. Therefore, I recommend that more samples than 24 need to be taken to increase accuracy. The majority of % error was inversely proportional to the actual species abundance (save for a few data points), regardless of the sampling strategy.

Was one sampling strategy more accurate than another?

Haphazard strategy had an average % error of 28.96, which is lower than that for Random & Systematic (36.46% & 53.39%, respectively) – there by being the most accurate sampling strategy in a forest terrain. The random strategy being the least accurate.
Blog Post 2: Sources of Scientific Information

Through the Wiley Online Library, I found the source of ecological scientific information I wish to use. I have chosen a journal article titled “Killer Whales (Orcinus orca) feeding on lumpfish (Cyclopterus lumpus) in northern Norway”, published in the journal of “Marine Mammal Science”. Press following link to find the article: https://onlinelibrary.wiley.com/doi/full/10.1111/mms.12618

I have also attached it as a PDF:

Blog Post 2

To classify this article, I followed the following chart:

Does the information source have all the following characteristics?

  1. Written by an expert in the field? Yes. A few of the authors are from the Universite de Montpellier and can be considered experts in their field.
  2. Does the source contain in-text citations? Yes. The authors use numerous in-text citations in their introduction to provide relevant background information and in their discussion to support and contrast their findings with past literatures.
  3. Contain a bibliography? Yes. Reference section begins on page 12 of article.

Since the article has YES to all three questions it can be classified as Academic Material.

Has the source been reviewed by at least 1 referee before publication?

Yes, this article had three anonymous reviewers (mentioned in Acknowledgments on page 11). Since the article is YES to being reviewed it is considered peer-reviewed.

Does the source report results of a field or lab study completed by the authors (containing “Methods” and “Results” sections)?

Yes. This article has a methods, data analysis, results, and discussion section. It can be considered Research Material.

 In Summary:  ACADEMIC – PEER-REVIEWED – RESEARCH MATERIAL

Citation:

Jourdain E, Karoliussen R, de Vos J, Zakharov SE, Tougard C. Killer whales (Orcinus orca) feeding on lumpfish (Cyclopterus lumpus) in northern Norway. Mar Mam Sci. 2020;36:89–102. https:// doi.org/10.1111/mms.12618

Blog Post 1: Observations

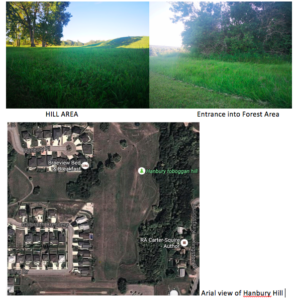
The area I have selected for my project is in the middle of the prairies in Brandon, Manitoba. The area’s location I have chosen has a few natural trails, a creek, and two distinct terrains with an immediate ecotone between the two. The first terrain is a forestry area with a gentl, slow flowing creek running down the middle, immediately adjacent to it is the second terrain a not-very steep hilly open grass field. Both these terrains are within an area classified as Hanbury Hill Park and are classified as a recreational-protected area. The Park is about 200 meters from a residential road.

My first visit to this location for observational purposes in regards to designing a study question:

  • Date: July 10th, 2020
  • Time: 5:30pm – 7:30pm
  • Altitude:
  • Temperature: 25C
  • Weather: Sunny, Clear skies, few clouds, slightly windy.
  • Seasonality: Summer

The size of area of interest:

  •             Hilly Grass Area: 20 yards
  •             Forest & Creek: 5 yards
  • Total area that will be studied: 25 yards

Observations:

Topography- Hilly Grass Area:

In terms of vegetation, the hill area has long grass species (~82 cm in height) with little variation, and is cut by the city once every month. There are a few trees very far apart from each other. The slope of the hill is not very steep ~20-degree angle at most on certain elevations. At the bottom of the hill is an outdoor Olympic sized track with few people running on it.

Species Observed:

  • Very few species of grasses
  • Gophers (& gopher holes)
  • Birds: crows and little sparrows
  • Deer
  • Grasshoppers
  • Ants
  • Occasional human walking or running past

There are a few biking trails pass through this area into the forest & creek terrain.

Topography – Forest & Creek Area:

This area is covered in numerous trees densely grown. Heavily shaded undergrowth due to the lush canopy of leaves provided from the trees. Trees and grass/shrubs in undergrowth are fully green and in bloom. The little creek has clear water slowly, and trickles down the creek that has rocks as its base.

Species Observed:

  • Very few species of trees
  • Deer
  • Some type of birds
  • Frogs
  • Humans (if you count myself and my lab assistant)
AREA OF OBSERVATION

Main Questions:

  1. What kind of species of gophers reside in the hilly area, and why are they not found in the Forest & Creek area?
  2. Is there more Deer activity in the hilly open grass area than the dense forest?
  3. Have the trails created by bikes influences how the animals and terrain interact with each other?

Blog Post 7: Theoretical Perspectives

The purpose of my research project was to investigate soil moisture as a potential limiting factor of tree size and frequency in my study area. In measuring soil moisture along a slope, an ecological process that my hypothesis and research touches on is the hydrological cycle. It focuses on water infiltration of near-surface soil, percolation and, indirectly, water uptake by surrounding vegetation and trees (Freedman et al. 2015). Ideas underpinning my research project include how gravity impacts water distribution in near-surface soil layers along a slope, how varying degrees of soil moisture impact surrounding vegetation, specifically trees in my research, and conversely, how vegetation impacts soil moisture.

Keywords: Soil moisture, slope, balsam poplar forest

References

Freedman, B., Hutchings, J., Gwynne, D., Smol, J., Suffling, R., Turkington, R., Walker, R. and Bazely, D. 2015. Ecology: a Canadian context. Second edition. Nelson Education, Toronto, Ontario, Canada.

Blog Post 6: Data Collection

I completed my data collection over two days (August 3rd, 2020 and August 4th, 2020), totalling approximately 11hrs10mins. Forecasts were similar throughout both days, averaging around 23°C with moderate to high degrees of sunshine. In the week leading up to my data collection there was only approximately 1.5mm of precipitation. I subdivided my chosen area into three subareas, and implemented systematic sampling. Across each subarea I collected data from 10 quadrats (2.4m x 2.4m), with 5 distinct soil moisture readings and percent slopes within each quadrat, as well as a tally of the number and types of trees present and their respective DBH measurements. I didn’t encounter any major problems throughout the data collection process, however navigating the terrain in some sections was challenging as was identifying certain trees.

Initial inspection of the data suggests that soil moisture, on average, was lowest at the bottom of the hill at mild percent slopes, mid-range at the top of the hill at high percent slopes and finally, highest at the midpoint of the hill at moderate percent slopes. These findings are contrary to my hypothesis but are partially representative of the results from the preliminary sampling exercise. In both cases, soil moisture was highest at moderate degrees of slope. In terms of tree size, the trees were, on average, largest at the bottom of the hill, and decreased in size as percent slope increased moving up the slope. Tree frequency showed a similar pattern, with frequency being, on average, highest at the bottom of the hill, with decreasing numbers as percent slope increased moving up the slope. These findings are also inconsistent with my hypothesis since I hypothesized that tree frequency and size would be inversely correlated.

Post 8: Tables and Graphs

The graph i submitted displays the data from one of my 4 sample plots (Plot 3). The predictor variable, elevation from the lake waterline, is presented on the X axis with the response variable, species composition (by percentage), on the Y axis. The sample plot was divided into 5 elevation zones, which made it easier to determine changes in species composition as elevation increased. This also made the data relatively simple to organise and graph. I took the raw data from each of these elevation zones and calculated the percentage abundance of each of the species in each zone. While the other 3 sample plots produced results that aligned closely with my prediction, the results from Plot 3 were quite surprising. I had predicted that the relative abundance Alnus rubra would decrease with increasing elevation, while the abundance of conifer species would increase. However, the graph showed a spike in conifer abundance and a sharp decrease of Alnus rubra abundance in the 2-3m elevation zone, and exactly the opposite pattern in the 3-4m elevation zone. This prompted me to analyse the substrate descriptions that I had recorded for each species in each zone. In the other 3 sample plots, substrates had progressively transitioned from deep, spongy and moist soil in the lower elevations to drier, sandier and rockier substrates in the higher elevations. However, in Plot 3 there was a patch of drier, sandier substrate in the 2-3m elevation zone, which prompted a decrease in Alnus rubra and an increase in conifer abundance, and a patch of moist, spongy substrate in the 3-4m elevation zone which saw an increase in Alnus rubra and decrease in conifer abundance. Hence, this graph prompted me to give more consideration to the influence of substrate on species composition, and make another graph that depicts changes in species composition in relation to changes in substrate type – from the most moist and spongy soils to the driest and rockiest substrates.


Post 7: Theoretical Perspectives

My research project looks at tree species composition in riparian ecosystems. Essentially, riparian ecosystems are highly dynamic and volatile environments due to the prevalence of natural disturbances, such as landslides and flooding. These ecosystems are highly competitive and the tree species that occupy them need to have adaptations to survive in the face of frequent disturbances and resource limitations. My project studies a stretch of riparian lake shoreline and investigates whether there is a relationship between flood frequency and species composition by analysing species composition at different elevations on the bank of the lake. My primary focus is on the species Alnus rubra, and determining first whether there is a correlation between more frequent flood disturbances on the lower elevations of the shoreline and increased relative abundance of Alnus rubra, in relation to conifer species.

Secondly, my research looks into potential reasons for such a pattern. I refer to a number of research studies that suggest levels of resilience to flood disturbance, tolerance to waterlogging, substrate preferences and reproductive strategies are responsible for the distribution of Alnus rubra and the conifer species across the flood prone, and upper elevations of the Nita Lake shoreline. Ultimately, riparian tree species composition is not stagnant, but always evolving through different stages of succession, which at any time can be disrupted by flood disturbance and turned back to the first stage. In order to predict species composition in riparian ecosystems, one must have an understanding of the life history strategies and adaptations of the different species that interact to produce these successional dynamics.


Keywords:

Riparian ecosystem

Flood disturbance

Life history strategies


Blog Post 2- Sources of Scientific Information

I found an ecology research paper in the online library (Cooke et al., 2016).

a) Cooke, J., DeGabriel, J. L., & Hartley, S. E. (2016). The functional ecology of plant silicon: Geoscience to genes. Functional Ecology, 30(8), 1270–1276. https://doi.org/10.1111/1365-2435.12711

b) This paper is academic peer-reviewed review-material

c) This is academic because it is written by experts in the field associated with the Department of Earth, Environment and Ecosystems, The Open University, Hawkesbury Institute for the Environment, Western Sydney University, York Environmental Sustainability Institute and University of York. There are in text citations and a bibliography. It does not have a “method” or “results” section so therefore would be considered a review article. There are no acknowledgments of a peer review process but the website for the British Ecological Society has a review process for the Functional Ecological journal.

Blog Post 1: Observations of Campbell Valley Regional Park

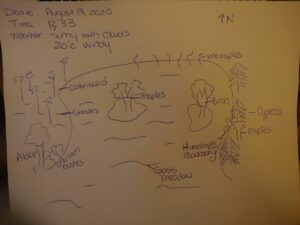
I visited my site on August 13, 2016

Time: 13:33-13:55

Weather condition: Sunny with clouds and slight breeze.

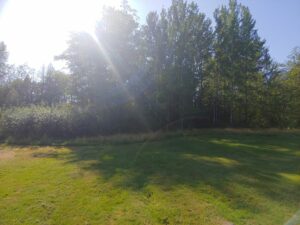
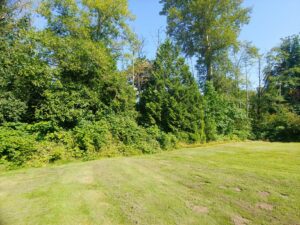
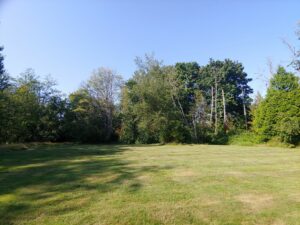
Location: Campbell Valley Regional Park, South Entrance, located in South Langley British Columbia. The location of Campbell Valley Park was clear cut in the early 20th century and the temperate rainforest has regrown. My study location is the Old Orchard area that is an open field surrounded by forest. There are many different tree species: Maples Acer psedoplantanus, Aspens Populus tremuloides, Cypress Cupressaceae, Birches Genus Betula to name a few. There are also vine maples Acer circinatum, invasive Himalayan Blackberry.

Questions:

  1. What is the abundance of tree species around the field.
  2. What is the abundance of plant species in the north section of the forest.
  3. Why is there a pure stand of Aspens on the west side of the field vs a mixed stand north and east?

Facing West

Facing East
Field site facing north.

Blog 2: Sources of Scientific Information

The paper I chose to look over was Herbivore grazing—or trampling? Trampling effects by a large ungulate in cold high-latitude ecosystems

This article is safe to say that it is academic because it is written by several experts in the respective field and it is based from original research from Department of Environmental and Health Sciences at the University College of Southeast Norway. There are also in text citations are present, followed by a References section that are of credible sources.

This research paper is also peer reviewed based on where it is published. It is from the Wiley Online Library where there are the requirements to meet their manuscript submissions. Including going through the processes of being peer reviewed and going through the editor. Additionally it has an accepted date of Accepted: 26 April 2017 after the received date that was January 27, 2017. So it is clear that it made it through all of those hurdles.

The article can be considered research material because it includes the requirement of materials and methods. And it also has specific experiment and analysis geared directly to this specific study.

Heggenes, J,  Odland, A,  Chevalier, T, et al.  Herbivore grazing—or trampling? Trampling effects by a large ungulate in cold high‐latitude ecosystems. Ecol Evol.  2017; 7: 6423– 6431. https://doi.org/10.1002/ece3.3130