Post 2: Sources of Scientific Information

A) Frederick J. Swanson, Sherri L. Johnson, Stanley V. Gregory, Steven A. Acker, 1998, Flood Disturbance in a Forested Mountain Landscape: Interactions of land use and floods, BioScience, Vol 48, No. 9, pp. 681-689, https://doi.org/10.2307/1313331

B) The paper is academic peer-reviewed review material.

C) The paper acknowledges reviews from “Rebecca Chasan, Penny Firth, Seth Reice, and an anonymous reviewer” before it was published, and the author’s use evidence from other people’s field studies rather than studies of their own, which indicates it is review rather than research material.

Post 1: Observations

June 1st 2020

The chosen study area is a roughly 400-metre stretch of riparian zone along the western shore of Nita Lake in Whistler B.C. The shoreline varies between steep and gentle inclines from the waters edge up to the train tracks which run parallel approximately 20 metres from the shoreline. The shoreline topography varies between steep terrain with large semi exposed stone boulders that are patchily covered in thin (2-inch) layer of coarse fast drained topsoil, and lower lying areas with deep, spongy and moist soils covered by a thick layer of decaying detritus. The vegetation is a mix of red alder, western red cedars, western hemlocks, and the very occasional Sitka spruce. Red alder trees appear to be the most dominant species closest to the waters edge, and grasses and young red alders are the only vegetation found in the lowest lying areas.

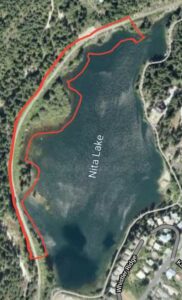
Large trees, (over approximately 6 metres tall) appear only to on the higher ground, with the exception of some older red alders by the water’s edge. Over the other side of the railway there is extensive forest with western red cedars, western hemlocks and Douglas fir.

The lake became fully unfrozen in early April, and stream flow into the lake progressively increased, peaking in late May. The Lake water level rose approximately 40cm between early April and late may, and has since subsided by around 20 cm. At peak water level some areas of lower lying vegetation were submersed.
Weather: I visited the site at 4pm, and the weather was overcast, with a temperature of 12C.

Questions:
1. Are red alder the most dominant species in low lying, waterlogged and flood prone areas?
2. Are Western Red Cedars, Western hemlocks and Sitka spruce better suited to fast draining soils?
3. Young red alders (mostly less than 1 metre in height) appear to be abundant in the low lying areas. Are they a pioneer species after flood events?


Blog Post-8

I had no difficulties in organizing, aggregating or summarizing my data. The outcome was also what I expected. Also, I came to a conclusion that birds do exhibit different feeding habitat s and they do it in order to avoid interspecific competition. My data was collected only over the starting of summer season. In order to learn more I would like to explore any changes that may occur in the abundance and abundance aspect relationships as different food varieties or different weather.


Blog Post-7

My project discuss a detailed study of why birds feed at different habitat s when there is food available to them. And if they exhibit different feeding habitat is what makes them do so. This study focused on common songbird species of various sizes and shapes. The theoretical aspects of my project are that species that are greater in size feed on the ground to conserve energy and the species that are smaller in size but are dominating feed at the feeder and the other ones mostly feed away from the feeder. My research is underpinned by idea such as interspecific competition, adequate weather for the birds to come out of their places. Some key words that could be used to describe my project are bird species and their different feeding habits

Blog Post -6

I started collected my data in month of April, during clear and sunny afternoon days. It was a very warm and windy day here in Vancouver Island. I just sat in observable distance from the feeder and spent an hour to collect the data. In order to thoroughly collect data, I decided to double the number of samples i.e. total 10 samples (days) in my final data and made replicates by including another feeder at my friend’s backyard in order to get supportive data for my hypothesis.  Before starting my sampling, I put the feeder for one day in order to let know the birds about it which I believe this simple adjustment helped me maintain a greater quality of samples and helped me record more bird species. I did not observe any new patterns during this exercise though I observed a unknown specie of bird so I named it as “unknown specie A”. The data collected seems to support my hypothesis.

Post 1: Observations

The area I have selected for my project is in Kananaskis Country in Alberta. This area has development of trails, recreation sites and highway 66 going through it. The location I have chosen is the Elbow River boat launch location on the South side of the highway and the Ing’s Mine trail area on the North side of the highway. Highway 66 going through the middle shows quite a gradient in the landscape. Both of these sites are within Kananaskis Country and are designated as Provincial Recreation Areas (PRA’s).

My first visit to this location was on 23/05/2020 at around 13:30hr. It was 7 degrees with wind and low cloud coverage hiding the surrounding mountains. The plants seemed to be in the beginning stages of blooming and the water level of the river was quite high due to spring melt.

The Elbow River boat launch location had a 500m trail heading West along the Elbow River. On the South side of the river there was a large rock wall. At the end of the trail along the North side there is about an 80% slope that has evidence of rock slides from the floods in 2013, as well as game trails along it. The elevation at the top of the slope was 1470m and it was South West facing at a bearing of 207 degrees. The Ing’s mine trail was at the same elevation on the North side of the highway. The terrain was flat other than the surrounding mountains.

Observed Species:

  • Kinnikinnick (Arctostaphylos uva-ursi)
  • Pine (unsure of species)
  • Birch
  • Bighorn Sheep (Ovis canadensis)
  • Canadian Geese (Branta canadensis) 

I found little variation in tree species and would like to look into whether this is natural or if the area has been previously logged? As well, there were two geese floating down the river with four goslings between them. At what age do the goslings go off on their own? The Kinnikinnick plant seemed very common in this location. What are some limiting factors of this species?

(Kinnikinnick could potentially be subject for research)

View from top of slope at Elbow River boat launch (South side of highway)

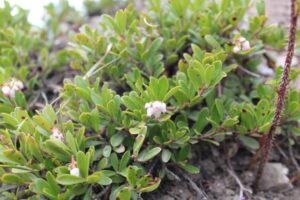
 Arcstaphylos uva-ursi

Blog Post 9: Field Research Reflections

Designing and carrying out an experiment as well as writing a paper utilizing a lot of academic research has given me much more of an appreciation and understanding of the scientific method and the development of ecological theory. Finding quantifiable patterns in nature is an extremely difficult task due to the amount of variables (confounding, hidden, and obvious ones) that are inherently affecting everything, and the difficulty in creating a controlled sample area outside of a lab. The study design was a lot more important and difficult to create than I had previously thought it would be. It took me forever to figure out what I wanted to study and how I could actually quantify an observable pattern. But once I finally figured out what to do, I had a great time designing and developing my own research project. It was an exciting experience to be allowed to focus on a project of my own design that reflected my own interests. I did have to change my design along the way, as I had to slightly move the locations of my study zones to minimize confounding variables (which through more research realized I may have not even succeeded in doing). In the end I should have researched a lot more about the method I was going to employ for the data collection in order to increase the accuracy of my results. I learned a lot about the limitations of what you can infer from your research. In the beginning I thought I could show direct relationships between certain variables (nutrition, cover), that after more research found that I did not really have data to directly support those relationships at all. This inspires me to continue learning more advanced chemistry and biology in order to one day hopefully employ certain advanced techniques in sampling and analyzing data. I learned a lot about the natural history of the Roosevelt elk and the Columbia black tailed deer, as well as their relationship with the forestry industry in BC in the process of this study. I am now more interested in wildlife and forest biology than I was before taking this course.

Blog Post 8: Tables and Graphs

Getting Microsoft Excel to put all the data I wanted into the graph in a logical way was extremely frustrating. I was not aware that it would be so complicated to format the spreadsheet properly in order to get the proper variables on the proper axes and the right data to be represented by multiple lines. Once I figured out the formatting and how to edit every single piece of the graph to be the right colour and the right line thickness, everything went well. I found that using the combination graph with three axes with different scales was actually not as simple as rearranging the data and using the scatterplot statistical graph for the two quantitative variables. Within this format I could embed two data sets on two lines to compare them in one graph instead of two separate ones, and I could then label the points and lines appropriately within the actual graph or using a legend. I wish there was a way to set a template with all the colours, data point symbols and line designs, so that every time I made a graph I didn’t have to go and change 20 different things in order to make it all look right. I also wish I had the money to pay for Adobe Pro so that I could put the graphs wherever the heck I wanted in my report and wasn’t subject to Microsoft Word’s authoritarian layout rules.

I found some interesting things when plotting the data, but it largely reflected my predictions and hypotheses. When I plotted the data in box plots to identify outliers it largely made up for any discrepancies in the patterns of my original data. I did not expect the elk or deer scat density to be so low in the riparian zone, nor did I expect the deer scat density to be so high in the forest. If I could, I would set up game cameras and see what the animals are up to and how often the deer actually do use the riparian zone. It’s quite obvious from the presence of deer tracks that they are using the riparian area, but for some reason their scat is almost absent. It’s possible the ground is so wet it dissolves, or is engulfed by the muck over time, or maybe they just quickly move through the area to access other feeding areas. One thing that would be worth investigating is whether elk are actually using this area on a yearly basis. If they are, they must cross the Island Highway in order to do so which poses a risk to human and animal life. If there was a way to increase their habitat on the other side of the highway and deter them from crossing into town just to spend a small fraction of time in this small area, then it may be wise to do so.

Blog Post 7: Theoretical Perspectives

My research focuses on two ungulate species: the Columbia black-tailed deer and the Roosevelt Elk. Underlying my  research into their scat densities and their relationship with differing dominant vegetation, is how these two species have adapted to resource partitioning within their similar niches. I look to touch on how nutritional availability changes throughout the year within the plant cells of their preferred food, as well as their differing nutritional needs. I also look to explore how not only nutrition but also predation affects their behaviour in choosing habitats, as well as how this predator pressure may influence their fitness. The understory of the forest in coastal BC is dense with fern, salal and huckleberry which give deer a year round source of food and cover, but during the winter they must share this habitat with the elk.  In spring and summer the elk tend to stick to meadows to eat grasses and sedges and are constantly migrating in order to sustain their nutritional needs. Deer also venture out into the open to use these areas mostly under the cover of darkness when predators are present in the environment. I am looking to investigate to what extent the elk use the grassy riparian areas opposed to the forest, and to what extent black tailed deer share this habitat and the forest with them.
The conservation of the Roosevelt elk populations on Vancouver Island is of great importance to not only the biodiversity of BC but also for ecological stability, anthropogenic economic benefit, and indigenous cultural importance. The preservation or creation of habitat is not only the responsibility of the province but also the forestry industry. More research should be done to see if seral stages or alternative stable states that would increase elk habitat could be allowed to develop by forgoing the application of silvicultural methods that suppress important food sources.

Keywords: Resource partitioning, niche breadth, competition, diet diversity, seral stages.

Blog Post 4: Sampling Strategies

The method I chose for the virtual forests tutorial was the area based method. The fastest sampling method was the systematic sampling method with a time of 12 hours 37 minutes, which was actually only within 20 minutes of the other methods. For the two most common species the systematic was the most accurate and was within a -7.2%  and 5.5% sampling error, compared to 63.4% and 100.9% error for the haphazard, and 11.2% and-29% error for the random method. For the rare species the haphazard sampling method was the most accurate of the three methods, although it still had a 52.4% error for the white pine and -8.5% for the Striped Maple. The random sampling method gave an almost 200% error for the White Pine and a 100% error for the Striped Maple, and the systematic sampling method gave a 174% and -100% error for the Striped Maple and White Pine respectively.

In general the accuracy declined with both the systematic and random methods as the species got more rare, and slightly increased in accuracy for the haphazard method for rare species. The Shannon-Weiner diversity was calculated to be the identical for the true diversity and the systematic method which leads me to believe that it was the most accurate method, along with having lower percentage error for most species present. For the random and haphazard methods the diversity was found to be 1.4 which is 0.1 lower than the true diversity. I don’t believe there was enough points to capture the diversity of species because in both the systematic and the random methods, one species was not observed at all. Even though the Shannon-Weiner diversity was found to be accurate for the systematic sampling method, I would consider increasing the number of samples in order to guard against inaccuracy.