Post 6- Data Collection

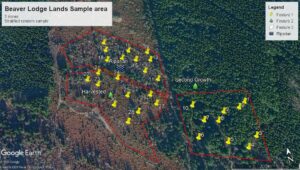
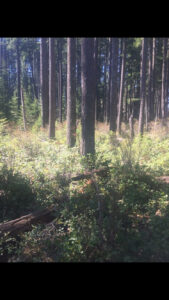
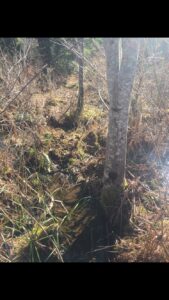
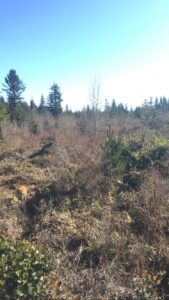
I collected all my data over the course of two days this past week. I made 5ha boundaries on three zones in my study area (80 year old second growth Douglas Fir plantation, Riparian zone, and 18 year old harvested early succession) and randomly generated 10 GPS points within each area. I had numbered them so that I would navigate to the nearest next point to alleviate the frustration I encountered having to walk the same area twice as I did during the test trial the day before. I had spent some time studying how to estimate percent cover of vegetation and I had bear bangers this time. I encountered patterns that reflected my hypotheses: the black tailed deer sign was most abundant in the forest and the elk sign was most abundant in the grassy wet riparian zone. It’s likely I have enough data to show some correlation with deer and shrub abundance, but it seems more likely that the deer are more abundant in the forest because there is more cover from salal shrubs for security reasons not for food reasons, whereas there is not as much sign in the open harvested area due to risk factors associated with predation and less browse (although I imagine nocturnally they are slightly more active in this area). Why the deer spend less time in the wet riparian zone is not clear to me yet, and may be something to do with niche and resource partitioning with the elk (though I’m uncertain the elk population is large enough for this to be a factor). The elk sign it seems was correlated with the presence of high cover of grasses in the riparian zone, but I also found sign in both other areas leading me to believe they also feed on shrubs as they traverse the landscape, but prefer to stick to areas when there are suitable grasses to feed on.

Post 5- Design Reflections

I performed the trial data collection a few days ago and found a few kinks in my design. I realized there a confounding variable in one zone (the second growth Doug Fir forest). There were a few mountain biking/dog walking trails that fragmented the area and the plot data that I collected in this section of the forest was completely absent of any ungulate activity at all (no old trails or anything), which is abnormal in my experience. As I continued to collect data and struggle over all the fallen trees and through the overgrown area I noticed that after I navigated across the last trail there was an increase in ungulate activity. I decided that when collecting my data for the final research I would randomize the points in an equally large 5 ha area south of this last trail (where there are no intersecting trails) in order to minimize the influence of human activity on the use of the area by deer and elk.

I also encountered some unexpected difficulty in accurately estimating percent cover of vegetation in the circular plotting technique that I decided upon. I tried my best to use the BC Ministry of Forest “Field Manual for Describing Terrestrial Ecosystems” and follow their guidelines for estimating in a circular plot and I will do my best to be consistent, but I imagine that by my last plot of the 30 replicates will be much more accurate than the first.

I found the randomization of points by GPS coordinates to be well suited for this study design, and I found that the AVENZA maps app on my Iphone to be easy to follow and navigate to the GPS point locations (though an external battery bank charger is necessary for extended amounts of time). The only issue was the accuracy, the GPS was only accurate to one decimal place of one second of latitude and longitude which theoretically should result in a 10×8 ft area for me to then have to try to randomize a location where the plot should go, but the GPS was jumping all over the place and I ended up having to estimate. I couldn’t just put it in the closest pile of deer scat or in the middle of a trail, and placing the plot in the middle of a bush wasn’t something that I would consider naturally. So, I decided I had to find the approximate boundaries of the points area and then estimate the middle so that I wouldn’t be biased in choosing a point.

I had intended on creating an inventory of all the shrub species that I found in each plot but quickly realized that there were species present that I couldn’t identify at this stage of the season. I decided to just enter them as other shrubs and not spend an eternity looking for defining physical characteristics.

One unexpected hurdle I did not expect was the compromising of my safety by choosing to navigate alone to GPS points in very thick bush where black bear and cougars have been recently sighted. I am well acquainted with traversing tough terrain from many seasons of tree planting, logging on the coastal mountain sides, and many extended hunting trips into the back country, so I did not really expect to experience some slight fear as I was half stuck in an Alder thicket looking down at fresh black bear prints following fresh fawn prints in the mud. I decided that I would forgo following this bear and possibly dead fawn into the next thicket just to collect my point data, and I would generate another random point instead. I decided to bring my bear bangers and some bells for my bag when I collect all my data so I don’t almost sneak up on a bear and its kill again.

Post 3- Ongoing Field Observations

I am planning on studying the relationship between ungulate presence and the abundance of certain vegetation types. There are 3 zones of interest that I will observe: 80 year old Second growth Douglas Fir plantation, Riparian zone, and 18 year old harvested area. When walking through these areas I have noticed an abundance of Cervus canadensis roosevelti  sign in the riparian zone but none in the other areas, whereas I have noticed lots of Odocoileus hemionus columbianus sign in the harvested area but not as much in the forest and riparian zone. I have also observed a higher proportion of Vaccunium parvifolium and Gaultheria shallon in the forest than in either of the other two areas, whereas there is a higher abundance of Alnus rubra and other deciduous trees and shrubs in the riparian zone along with ground cover abundant in grasses. The harvested area is evenly covered in Vaccunium as well, but it seems to be less abundant than in the forest. Most of the ground cover in the harvested area at the moment is dead Pteridium aquilinum, but there are also new conifers as well as sparse large deciduous trees and shrubs.

Hypothesis: Cervus canadensis roosevelti sign is more abundant in areas with higher % cover of grasses and lower in areas with low % cover of grasses.

Prediction: Cervus canadensis roosevelti sign is more abundant in the Riparian zone where there is higher % cover of grasses and lower in the forest and harvested area where there is little to no grass cover.

Predictor variables: Riparian zone, Harvested area, Douglas Fir plantation (Categorical)

Response variables: % cover grasses (continuous), # of Cervus canadensis roosevelti scat groupings(Continuous)

Field Journal- scan0024

Blog post 2: Sources of Scientific Information

I found an interesting study cited here:
Couch, C. S., Burns, J. H. R., Liu, G., Steward, K., Gutlay, T. N., Kenyon, J., Eakin, C. M., & Kosaki, R. K. (2017). Mass coral bleaching due to unprecedented marine heatwave in Papahānaumokuākea Marine National Monument (Northwestern Hawaiian Islands). PLoS ONE, 12(9), 1–27. https://doi-org.ezproxy.tru.ca/10.1371/journal.pone.0185121

This is academic peer-reviewed research material.

I came to this decision because the authors are professionals in their field and are associated with The University of Hawaii, the US Fish and Wildlife Service, The Pacific Islands Fisheries Science Center, The National Oceanic and Atmospheric Association, and Global Science and Technology Inc. The first two authors mentioned have PhD’s in the relevant field of study and are associated with the University of Hawaii. The rest vary, with one author mentioned (Kanoelani Steward) being a student of the Marine Science Program at the University of Hawaii.

Courtney S. Couch1,2*, John H.R. Burns1, Gang Liu3,4, Kanoelani Steward5, Tiffany Nicole Gutlay1, Jean Kenyon6, C. Mark Eakin7, Randall K. Kosaki8

1. Hawai‘i Institute of Marine Biology, Kāne‘ohe, Hawai‘i, United States of America,
2. Ecosystem Sciences Division Pacific Islands Fisheries Science Center, NOAA Honolulu, Hawai‘i United States of America,
3. Coral Reef Watch,NOAA/NESDIS/STAR,College Park,Maryland, United States of America,
4. Global Science & Technology Inc. Greenbelt, Maryland, United States of America,
5. Marine Science Program University of Hawai‘I at Hilo,Hilo Hawai‘i,United States of America,
6. U.S.Fish and Wildlife Service,Honolulu, Hawai‘i,United States of America,
7. Coral Reef Watch,NOAA/NESDIS/STAR,College Park,Maryland, United States of America,
8. NOAA Papahānaumokuākea Marine National Monument, Honolulu,Hawai‘i,United States of America

There is also in-text citations that hyperlink to the cited material, which is also all present in the References section. For example:

“Coral bleaching involves the breakdown of the symbiosis between a coral and its endosymbionts (Symbiodinium spp.) in response to environmental stress (such as anomalous changes in temperature[1–3], salinity[4], sedimentation[5], and/or light[6], resulting in the expulsion of the algae[7].”

It is peer reviewed because it explicitly states in the Acknowledgements that it was reviewed by a named woman and three unnamed reviewers.  Shown here:

“Thank you to Eileen Nalley and three anonymous reviewers who provided feedback that greatly improved the quality of this manuscript.”

And finally it is research material because it is clearly a research project with a Methods and Results section including accompanying graphs, stats, and interpretation of the data in reference to the hypothesis.