Blog Post 9: Field Research Reflections

       This experiment was a combination of stress and pride as it was my first time designing and carrying out an entire research project! It was an interesting journey filled will multiple challenges and resulted in a project that I am very proud of.


        The major issue I ran into was weather changes. I was not prepared for how quickly the temperature declined this fall, and as a result, my variables may have been confounded. If I were to re-do this experiment, I would have began this as early as possible and completed my replicates while the temperatures were consistent. In addition to this, I would have adjusted how I approached my replicates. Instead of doing the replicates for each treatment on different days, I would have done them all in one day. This way, I would have had consistent temperature and weather, thus reducing confounding variables and improving the accuracy of my results. As a result of not doing both the the previously mentioned items, I had to change my second treatment from one flower to another. I chose to change the flower as my first choice was too withered to be considered viable for my experiment. Perhaps I will never know if this made a dramatic difference in my observations, but every consistent variable counts!


       This course and experiment has given me a much more engaging perspective on the scientific method and ecological science as a whole. The final project in conjunction with the textbook readings has evolved my appreciation for environmental science and I look forward to furthering my knowledge in this with future schooling!
Post #8: Tables and Graphs

Everything surrounding the process of making the graph was straightforward and I knew already what kind of graph would best summarize my data, so all of this was smooth sailing. However, I was rather surprised when I saw the final result of my graph. I had an idea of what I thought the pattern should look like from the assignment earlier on in the course, but when I collected my data I thought there was no way my graph would even come close to replicating my prediction. I was ready to reject my hypothesis and was gearing up to take my study in the direction of exploring the other variables of why this hypothesis had no effect. However, upon seeing the final result of my graph I noticed that it was not anywhere to a close replicate, but the data did somewhat behave as I thought it would. Rather that moving in a smooth bell shape, it spikes up and down a little more than I thought, and I would love to find out what other variables were causing that reaction among my quadrats. And although it was a little more rigid, it does more or less follow the predicted pattern of starting moderately, rising and then descending to the lowest part of the graph. That realization was quite exciting for me! It made me really want to dive deeper into the other factors at play on this species in this ecosystem, as well as made me more fascinated by the cattails themselves.

All in all, I’m feeling very grateful for this class and this project for giving me a new curiosity in this field, and I’m very eager to finish the rest of the project and the class.

Post #7: Theoretical Perspectives

I am studying how the abundance of Typha latifolia affects the timing of their seed dispersal. First and foremost what I will need to consider in this study is the reproductive behaviour and processes of this species as well as how they behave with each other and with other species in their respective ecosystems. Whether their seeds are resilient and their reproduction is easily achieved will be crucial things to consider as well as whether they live harmoniously among other species both of their own kind and others. This will give me very valuable information in order to properly interpret my data. However, because ecosystems are complex and there are many variables involved, other factors begging to be considered are nutrient availability (because one would assume species with enough nutrients would reproduce more optimally than those malnourished) and environmental factors such as wind, temperature and light (because these are also things that could effect reproductive behaviour). What I aim to do in my research is find out when cattails best like to reproduce and find out if the amount of neighbors of their own species present has anything to do with the timing of their seed dispersal. Some keywords I would include for this study would be invasive species, seed dispersal, reproductive behaviour, and interspecies competition.

Blog Post Six: Data Collection

My data collection went fairly smoothly, similar to the collection we made of preliminary data. I did twenty replicates of 1M2 as planned to heighten the sample size. My sampling did however include some changes than what I proposed in my first small assignment because when I went to the pond to collect my data, I saw that one half of the pond had had all of the cattails completely levelled and removed. I was still able to space them approximately ten feet apart and maintained the sample size I wanted, however this means that one half of the lake was completely unsampled which is a shame because the two sides of the pond definitely differ in light as well as elevation from the pond and now I am not sure whether those are confounding variables that will influence the data.

Despite the fact that the collection process went smoothly, one thing I will note is that I can already see from the data that it did not progress as I predicted it would, and I am looking forward to analyzing it further and discussing why I think this was the case. One thing I also realized was that there are some large trees semi-nearby the pond that I did not factor into the abundance hypothesis, and I am not sure what effect if any they had on the data I collected.

Blog Post 4

The results of the virtual tree sampling tutorial showed that the haphazard sampling method is the most efficient in terms of time spent, at a total of 12 hours and 30 minutes. This is in contrast to systematic sampling which took 12 hours 37 minutes and random sampling at 12 hours and 51 minutes.

Haphazard sampling is the most accurate method for common species. When measured with the haphazard method, the two most common species, Eastern Hemlock and Red Maple, had percentage errors of 3.34% and 29.7% respectively. In contrast, systematic sampling was the least accurate method for both species (18.3% for Eastern Hemlock and 41.3% for Red Maple).

Systematic sampling is the most accurate for some rare species but not others. For Striped Maple systematic sampling had a percentage error of 14.3% and for White Pine 185%. Random and haphazard sampling had a percentage error of 100% for White Pine.

For common species all sampling methods were relatively accurate. Accuracy declined for all methods as species rarity increased. The most rare species, White Pine, had the lowest accuracy for all sampling methods. For rare species, 24 sampling units may not be enough to get an accurate representation of their abundance. Therefore, although time consuming, increasing the sampling unit size may be necessary when studying rare species of trees and other plant life. Increasing sampling unit quantity would increase accuracy of abundance for all species, both rare and common.

Blog Post 2: Sources of Scientific Information

The paper I chose was ‘Winter ecology of striped bass (Morone saxatilis) near its northern limit of distribution in the Saint John River, New Brunswick’ written by S.N. Andrews, T. Linnansaari, R.A.Curry, N.M. Leblanc and S.A.Pavey.

This is an example of an academic, peer-reviewed research paper. It is considered an academic paper because the authors are all affiliated with universities in New Brunswick and therefore it can be deduced that this research was conducted as part of their professional work. Furthermore, the paper includes in-text citations and a reference list at the end, adding to the academic nature of the report.

It does not explicitly state that it is peer-reviewed, however, it does list “received” “accepted” and “published” dates at the beginning of the paper. Furthermore, the journal in which it was published, Environmental Biology of Fishes, only accepts peer-reviewed articles, as stated on their website:

“All papers must undergo the normal peer-review process, which includes the possibility of rejection. This process will be handled by the guest editors within the online reviewing system. The Managing Editor will provide proper training to the guest editors as requested.” (Environmental Biology of Fishes: Submission Guidelines).

It is a research paper because it reports original research, and includes ‘results’ and ‘methods’ sections. It does not synthesize or review research from previous studies, therefore it is not a review paper.

References:

Andrews, S.N., Linnansaari, T., Curry, R.A., Leblanc, N.M. & Pavey, S.A. (2020). Winter ecology of striped bass (Morone saxatilis) near its northern limit of distribution in the Saint John River, New Brunswick.Environ Biol Fish 103, p 1343–1358. https://doi-org.ezproxy.tru.ca/10.1007/s10641-020-01027-x

Environmental Biology of Fishes: Submission Guidelines. [website]. Retrieved from: https://www-springer-com.ezproxy.tru.ca/journal/10641/submission-guidelines on December 30, 2020.

Blog Post 1: Hay River, NT

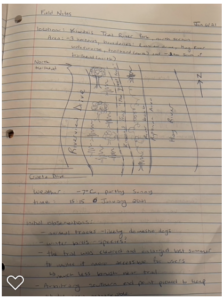
The site that I chose for my field study is an area along the bank of the Hay River in Hay River, Northwest Territories. The river park extends for about 2.2km from the Vale Island Bridge to the local high school. I chose an approximately 1.5km long by 50m section of the park to focus on for the study. The northern border is demarcated by the northern trailhead entrance near my house. The eastern boundary includes the Hay River watercourse, which is currently frozen in a thick layer of ice. The southern boundary is the end of the trail which leads up to the parking lot of the Power Corp office building. The western boundary is demarcated by Riverview Drive.

My initial site visit was conducted on January 6, 2021 at 15:15. It was partly sunny and -7 degrees Celsius. The day was particularly warm for this time of year, as average temperatures have been hovering around -25 degrees. The area is heavily snow covered; a full visualization of flora and fauna was limited.

This area would be classified as a town park bordered by residential zoning and is comprised of riparian and woodland areas. Through the park runs the Kiwanis Trail, a walking path that was enlarged in summer 2020 to make it more accessible for walkers. This included clearing brush from the sides and packing down dirt on the trail to make it a more even surface. A section of the trail which runs behind the high school and then up to the Power Corp was not enlarged or cleared and has been left to become overgrown with plant life and fallen trees.

The park contains a lush array of woody trees, shrubs, brushes, grasses and flowering plants. On the eastern side, the riverbed has a steep eastern facing slope covered with brush, shrubs, and flowering plants. This steep slopes levels off to the river bottom below and the frozen Hay River. In the spring through fall, I have encountered a variety of wildlife in the area including sand hill cranes, groundhogs, squirrels, various birds, black bears and lynx. On my winter site visit I observed only one brown squirrel and a few small brown birds.

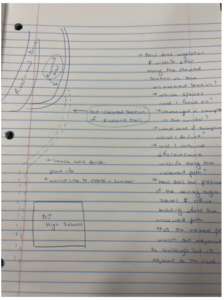
Upon exploring the area, I developed four questions which will act as the base for my future study and analysis of the area:

  1. Did the widening of the Kiwanis trail (including removal of brush) impact wildlife biodiversity and habitats in the area?
  2. Does biodiversity and wildlife behaviour differ between the cleared section of trail and the trail left intact?
  3. How did summer 2020’s record high water levels impact the vegetation, slope stability and wildlife in the area?
  4. How will the area change through the seasons? This includes migration of species and growth of plant life in the spring.

Field Research reflections

This was my first time doing field research and it went better then I thought because of that. I did have challenges with weather changing at first but once I found a time of day that was relatively consistent it went much better. Writing the field report was also challenging for me. Making sure all the data I had was in the right section and used correctly was difficult. I have a greater appreciation for  scientists that do this type of work regularly. Environmental ecologists have to contend with so many elements that are out of their control that I have a greater appreciation for them in particular. When conducting field research they cannot control the weather or other disturbances that may affect their study. Events like that can really affect the outcome of a study. Taking into account all the elements they cannot control is a lot of work. Even for my little study not being able to control the weather made it hard at first to conduct.

Post #5 Design Reflections

I would say that all in all, collecting the data for my field study was fairly straightforward and I believe it was an effective way to get the information required by my hypothesis. Some of the notable difficulties I faced in collecting this information was that the quadrats were muddy and wet to get to as the cattails grow on the edge of a pond and the season had the ground very waterlogged, as well as the cattails are quite tall compared to me so I brought along a taller person to help verify I was getting the right numbers. However, I would collect data the same way in the future. I was able to guarantee the measurement of my quadrats easily and the random step generator made it so that I was still collecting from random sample sites even though my species of study occurred along a straight line around the lake. The data that I collected was surprising in that when I did the initial observations, I was sure that the more crowded areas had more intact catttails than the less crowded areas (as is predicted by my hypothesis) but the data did not show this pattern. But, as is science I suppose. If I were to make any changes, I would perhaps like to do more quadrats than five to see if that affected the results at all.

Blog Post 2: Sources of Scientific Information

I chose the review article “DLK2 regulates arbuscule hyphal branching during arbuscular mycorrhizal symbiosis” by Ho-Palagaro et al. The receptor in question has been elucidated to have implications in mycorrhizal chemical ecology, namely in distingushing between strigolactones and karrakins.

This is an example of academic, peer-reviewed research material. It is published in the journal New Phytologist, which only publishes peer-reviewed papers. It is primary research, since the authors carried out their own study and data analysis, rather than synthesizing information from the existing literature. The attached image outlines New Phytologist’s policies.