Blog Post 1: Observations

I have selected a section of Cuthbert Holmes Park in Saanich as my area of study. Cuthbert Holmes is a municipal park, under the jurisdiction of the District of Saanich. The park itself is around 26 hectares, but the area I will focus on (referred to as “The Point” on park maps) is around half an acre. It is a relatively flat estuary abutted by a young forest. This park stands out to me for two reasons.

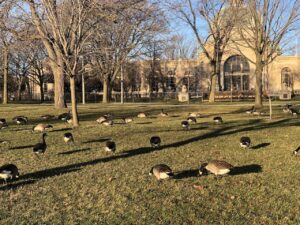
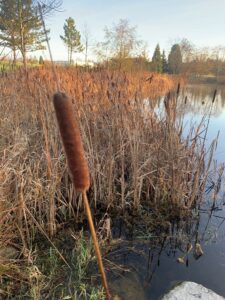
First, it marks the headwaters of Portage Inlet, an urban estuary which runs through the Capital Regional District. Portage Inlet and the Gorge Waterway are host to a wealth of urban wildlife. This section of Cuthbert Holmes Park stands out for it’s mudflats, a brackish marsh area which marks the transition from freshwater stream to estuary. Currently, the mudflats are almost entirely flooded, which as I understand happens seasonally. Previously, the area was home to Vancouver Island’s largest blue heron rookery (https://www.saanich.ca/EN/main/parks-recreation-community/parks/parks-trails-amenities/signature-parks/cuthbert-holmes-park.html), and although the birds are not currently nesting here they still use the park’s waters for feeding.

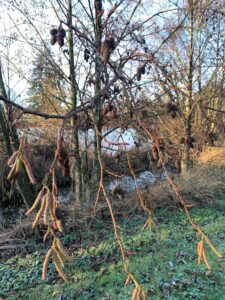
The second reason this location stands out to me is its history. Previously under industrial and agricultural tenure, the area has been restored in the last few decades. This includes the salmon habitat of Colquitz Creek, the waterway which flows into Portage Inlet. I would like to take the opportunity to observe how this park continues to rebound post-restoration. The portion of the park I have chosen to focus on is right on the margin of development: on one side of the mudflats are residential backyards, while the other side is young second growth coastal douglas-fir forest. The invasive Himalayan blackberry (Rubus armeniacus) and English ivy (Hedera helix) have overtaken the margins and the understory of the area, respectively. Some grand fir (Abies grandis), arbutus (Arbutus menziesii), Garry oak (Quercus garryana) and many douglas-fir (Pseudotsuga menziesii) make up most of the tree species in the adjacent forest.

I’m visiting the park with ecological observation in mind for the first time today, December 17th. It is late morning on a relatively warm, sunny day.

Potential questions to explore:
-The Saanich website claims that bald eagles are to blame for the disappearance of blue heron rookeries. What other factors might be keeping blue herons from nesting in the area?

-In the areas overrun by blackberries and ivy, what effect are invasive species having on the overall species composition? Do these effects ripple down through different trophic levels?

-Garry oak are a drought-adapted species of tree. The Garry oaks at the edge of the water are subject to seasonal flooding. I wonder if these trees established at a time when the mudflats were drained for agricultural purposes. Is it possible that the Garry oaks situated below the flood line are less fit than the trees which are not exposed to seasonal flooding? Are these trees ultimately destined to succumb to flooding stress?


Blog Post 8: Tables and Graphs

Based on my data I created a table as my data is best suited to that form of depiction. I struggled at first setting my data in the table as there are many components to it that are connected, but need to be viewed separately as well. After reading the articles for the course and seeing how the tables were organized I came up with a solution that worked well for my table. The outcome of my study was what I expected as the results indicated that vegetation is a major factor in the amount of ants present in a given area. An area that I would be interested in exploring that arose from my data is how weather may affect the amount of ants seen. I live in an area that has very windy periods, especially in the winter. I found that on the days when it was windy there were no ants presents. Exploring this further could prove very interesting.

Post #3: Ongoing Field Observations


  1. Identify the organism or biological attribute that you plan to study. Canadian Geese 
  2. On the grass: every goose is more spread out from one another. Their distribution is more spread out and everyone is picking at the grass, looking for something to eat. There are a lot ~30 geese presentBy the trees: in the summer months the geese were either under the trees or some of them were in the sun (sunbathing). they were always in groups thoughOn the lake: only a few left the group to go to the lake but they always go in groups. Around 6-7 of them were present on the lake and they peck at the water at first and stood by the riverside and then eventually went in the lake with some of them swimming and some still on the edge.

  3. Think about underlying processes that may cause any patterns that you have observed. A: All of the geese stay in pairs, even though they may be spread out from another, they are always together.  Postulate one hypothesis and make one formal prediction based on that hypothesis. Hypothesis: What is in the habitat of Canadian Geese that causes them to gather in large numbers? What food sources do Geese look for on the grass?
  4. Based on your hypothesis and prediction, list one potential response variable and one potential explanatory variable and whether they would be categorical or continuous. Use the experimental design tutorial to help you with this.

Response Variable: Which foods are rich in grasslands that cater to the diets of Canadian Geese.

Explanatory Variable: The types of food sources available. (Categorical)


Post #2: Sources of Scientific Information

One ecological information source is a website called allaboutbirds.org. It is an organization that gains information from other sources. The source is -> https://www.allaboutbirds.org/guide/Canada_Goose/lifehistory#

b) I would classify it as academic material that is not peer-reviewed.

C) Even though they have credited their sources of information, it is more of an information website to gain information on the topic(s) one’s interested in rather than a formal peer-reviewed piece of work.


Post #1: Oberservations

The area that I choose to study is the lakeshore area of Toronto, more specifically the little park across my apartment. This park and trail is thin and lengthy spanning over many kms. I will just be analyzing the area of the park that is closest to me. It is located beside a major roadway. It is flat with some rolling hills here and there but nothing major. The vegetation is grassland and city street. The park is regulated by city property. I visit the park every day for the past couple of months; however, right now we are in winter time and the temperature is cold and dry (for the most part). I would like to study the geese that are always at the park, and the squerrels that are present
The questions/ hypothesis
1) What types of habitats are used by Canadian Geese? Which species are present, both biotic and abiotic?
2) Which tree species are used by squirrels? (use point counts in areas with different trees)

Post #4 Sampling Strategies

Overall, the most efficient method of sampling for my results was the random sampling. On common species, it had a percentage error of 7.5% versus 13.8% for systematic and 43.6% for haphazard sampling. It also had the best percentage error at 72.4% for the rare species, versus ? (did not account for the species) for systematic and 198.2% for haphazard sampling. Considering the fact that random and systematic had only a 27 minute difference in sampling times (12h38m vs 12h11m), it shows how much more efficient and accurate random sampling can be in both achieving results and saving time and resources in research. Haphazard sampling was the least accurate in terms of percentage error, but visiting the 5 sites versus the 24 of the other methods only took two hours and forty minutes. One notable thing I encountered while doing this activity is I found was that despite the 43.6% percentage error of common species for haphazard sample, this was due to skew because the two most common species having percentage errors of 86.25% and 0.925%, and that last value was the most accurate of any species using any method, the second smallest percentage error being 3.2%. Another interesting find was that systematic sampling had relatively similar accuracy for the common species, but it did did not register the two rare species that both random and haphazard sampling did. This is interesting because despite the fact that the haphazard sample sites were strategically chosen, but it only had a fifth of the quadrants as systematic sampling and a much higher percentage error of common species. What these results showcase is the strength of random sampling and what effect human bias can have on the results of sampling.

Post #3 Ongoing Field Observations

I have continued to do field observations in my area of study. One my last visit, I identified two very interesting phenomena that did not catch my attention the last few times I have been there. I am not quite sure which experiment I am going to choose, so I am going to write this post inclusive of both of them and perhaps with some feedback and further consideration I will come to a final decision.

Option One:

I may choose to study the cottontails that surround the pond. There is a large amount of them in varying abundance in different groups around the pond. During my last visit, I noticed that some of the cottontail heads are beginning to fall apart, which I assume is for reproduction similar to how dandelions reproduce because they seem to fall apart into white fluff that seem like seedlings. However, some groups have many cottontails that have fallen apart or began to fall apart easily upon some light shaking and tapping with a stick. Other groups in the pond had cottontail heads that were still very firm and remained that way with similar shaking or tapping. After considering variables such as cottontail height, sunlight, cottontail abundance, and moisture, there did not seem to be any patterns. I later realized that I was not taking into account the pine trees as part of the abundance, and noticed that it seemed that the more crowded an area was, the less likely it was to have cottontails that were falling apart. I hypothesize that the cottontails that have less vegetation nearby and therefore less competition fall apart and reproduce faster, ensuring them better success and fitness, because they have better access to the available nutrients in the ecosystem. My prediction is that cottontails in less crowded areas would fall apart earlier and cottontails in more crowded areas would fall apart later in the season. Possible response variables could be the degree to which the cottontails have fallen apart (continuous) or the ratio of cottontails that have fallen apart versus stayed intact (continuous) and the possible explanatory variable could be number of cottontail heads in a given study area (continuous), number of trees and distance from the identified group of cottontails (continuous).

Option Two:

As I noticed the role of the pine trees in this pattern with the cottontails, I saw that they were in the process of making and dropping pine cones. Some trees had many early pinecones and some trees had many late stage pinecones in a way that varied greatly from tree to tree. I thought perhaps that they followed a similar pattern as the cottontails in terms of crowding and competition, but this did not seem to have any recognizable pattern. However, because this visit was done during clear skies, I was able to see how the sunlight hit the trees for most of the day and the path it would take across the sky over the daylight hours. That is how I noticed that the trees that got more sunlight seemed to have more early stage pinecones and the trees blocked by the shade of other trees as well as the branches that got less direct sunlight had more of the late stage pinecones. I hypothesize that decreasing sunlight is a trigger that signals to the plant that it is winter and time to shed the non-useful parts of the tree, triggering the shift from early to late stage pinecones. I predict that the trees that receive the most direct sunlight will shift into late stage pinecones later in the season that those that do not receive as much direct sunlight. The response variable would be the ratio of early to late stage pinecones (continuous) and the explanatory variable would be sunlight amount (low light versus high light) (categorical).

Post #2 Sources of Scientific Information

The source of scientific ecological information is an article from Science Advances found here: https://advances.sciencemag.org/content/6/47/eabb7232

I would classify this source as being peer reviewed academic research material. My reasons for doing so include the fact that this is a study that includes both methods and results sections that evaluates data from the field of tropical rainforests, it is published in a Science journal who have peer review as one of their prerequisites for publishing journals, as found in their editorial policies found here: https://www.sciencemag.org/authors/science-journals-editorial-policies, and this paper was written by authors are are all from Earth and/or Environmental science departments of their respective higher education communities, classifying them as experts in their fields, they have in text citations and a bibliography of 64 sources relevant to their topic.

Blog Post 8 – Tables and Graphs

For my Small Assignment Submission #5 I chose to input my data into a graph to best summarize my data. In order to make the graph more user friendly, I had decided to use the averages of the replicates I performed in each treatment level and put those into my graph so clearly show the trend. I’m not sure if this was the best option as the graph is very simple and perhaps in this case more information may be better (despite what the tutorial had indicated). Either way I was able to see a trend in my data. From treatment level 1 to treatment level 2 there is an easily noticeable decline in the Western Honey Bee pollination activity numbers (from an average of 6.9 from treatment level 1 to 3.1 from treatment level 2). From treatment level 2 to treatment level 3 there is a decline but it is not nearly as noticeable or dramatic as the previous relationship mentioned (from an average of 3.1 from treatment level 2 to 2.8 from treatment level 3).

Although I was expecting perhaps a more consistently downward trending graph, the data still agrees with my initial hypothesis. I will continue to think about adjusting my graph to allow for more information to be present, while also maintaining a user-friendly appearance. My graph has been attached for reference. Module 9 Assignment

Post #1 Observations

The area that I have chosen to observe is a nearby city park called The Bill Reid Millennium Amphitheatre. The area of the park is approximately 200m x 1000m. The landscape and vegetation is nearly flat with some hills, covered mainly with grass and strategically placed trees that line the path ways and act as a barrier from the busy roads that surround the park on two of its four sides. A few single trees are placed throughout the grass field at various points.  It also contains a ravine that runs between the main path of the park and the sidewalk that runs alongside Highway 15, and a pond at the far south side of the park beside a quiet road. The initial visit was done on 15 November 2020 from approximately 6:15-6:50am. It was dark when I first arrived and the sunrise had just begun when I was leaving my initial observations. I believe the temperature was approximately 0-3 degrees Celsius and it was cloudy with various breaks that revealed the clear sky. There was no precipitation. It was about a month before the official beginning of winter so temperatures have been dropping and will continue to drop and the ecosystem has been receiving large amounts of precipitation. Because i will be observing and conducting my study in the winter, there will likely be no growth and little activity in the ecosystem but I would be interested in learning about how the ecosystem adapts to survive the harsh conditions of winter and what patterns might be seen during this season.

Some questions I might consider for my final project include:

How do non migrating chickadee birds acquire energy and choose to expend it in preparation for the winter months?

How do the ducks in this ecosystem behave in preparation for migrating south for the winter? Or, will they?

How do ducks behave socially in the winter months? Are they competitive or cooperative? Why might this be the case?

How does the vegetation adapt or behave to make it through the cold temperatures of the winter?