Blog post 4: Sampling Strategies

  • The technique with the fastest estimated sampling time was the systematic sampling technique which took 12 hours and 35 minutes for 25 samples. However, the random sampling method did not significantly differ in its time frame when compared to the systematic sampling technique. The difference between the systematic and random methods was 9 minutes.


  • Systematic sampling method:


Two most common species:


Eastern Hemlock ® (564.0-469.9)/469.9 * 100 = 20.0%


Sweet Birch® (52.0-117.5)/117.5 * 100 = 55.7%


Two least common species


Striped Maple® (16.0-17.5)/17.5 * 100 = 8.6%


White Pine® (12.0-8.4)/8.4 * 100 = 42.3%


  • Random sampling method


Two most common species:

Eastern Hemlock® (433.3-469.9)/469.9 * 100 = 7.8%


Sweet Birch® (87.5-117.5)/117.5 * 100 = 25.5%


Two least common species

Striped Maple® (20.8-17.5)/17.5 * 100 = 18.6%


White Pine® (25.0-8.4)/8.4 * 100 = 197.6%


  • Haphazard method


Two most common species:


Eastern Hemlock® (492.0-469.9)/469.9 * 100 = 4.7%


Sweet Birch® (64.0-117.5)/117.5 * 100 = 45.5%


Two least common species

Striped Maple® (16.0-17.5)/17.5 * 100 = 8.6%


White Pine® (12.0-8.4)/8.4 * 100 = 42.3%


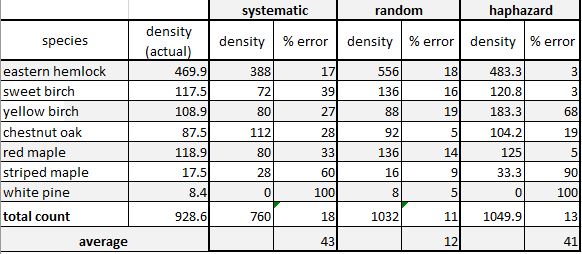
  • The accuracy did change with species abundance. The accuracy decreases as the abundance of a species decreases.


  • The most rare species identified as the “White Pine” had a percentage error difference of 42.3% for both the systematic and haphazard method ruling the random method with a percentage difference of 197.6% as the least accurate method. Since the systematic method is the least time-consuming method it is considered overall the best and most accurate method to use.


Blog Post 4: Sampling Strategies

  1. Which technique had the fastest estimated sampling time?

Systematic sampling was the fastest since the sampling quadrants were relatively close to each other.

  1. Compare the percentage error of the different strategies for the two most common and two rarest species.

Systematic Sampling:

Two most common:

  • Eastern Hemlock density was 469.9 stems/ha whereas the calculated density was 484.0 stems/ha.

The percent error = (484.0 – 469.9)/ 469.9* 100 = 3%

  • Sweet Birch density was 117.5stems/ha whereas the calculated density was 108.0stems/ha.

The percent error = (108.0 – 117.5)/ 117.5* 100 = 8.1%


Two rarest species:

  • Striped Maple density was 17.5 stems/ha whereas the calculated density was 16.0 stems/ha.

The percent error = (16.0 – 17.5)/ 17.5* 100 = 8.6%

  • White Pine density was 8.4 stems/ha whereas the calculated density was 0.0 stems/ha.

The percent error = (0.0 – 8.4)/ 8.4   * 100 = 100%

 Total time to sample: 12 hours, 37 minutes

Random Sampling:

Two most common:

  • Eastern Hemlock density was 469.9stems/ha whereas the calculated density was 575.0 stems/ha.

The percent error = (575.0 – 469.9)/ 469.9* 100 = 22.4%

  • Sweet Birch density was 117.5stems/ha whereas the calculated density was 129.2 stems/ha.

The percent error = (129.2 – 117.5)/ 117.5* 100 = 9.96%


Two rarest species:

  • Striped Maple density was 17.5 stems/ha whereas the calculated density was 25.0 stems/ha.

The percent error = (25.0 – 17.5)/ 17.5* 100 = 42.9%

  • White Pine density was 8.4 stems/ha whereas the calculated density was 4.2 stems/ha.

The percent error = (4.2 – 8.4)/ 8.4   * 100 = 50%

Total time to sample: 12 hours, 49 minutes


Haphazard Sampling:

Two most common:

  • Eastern Hemlock density was 469.9stems/ha whereas the calculated density was 548.0 stems/ha.

The percent error = (548.0 – 469.9)/ 469.9* 100 = 16.6%

  • Sweet Birch density was 117.5stems/ha whereas the calculated density was 120 stems/ha.

The percent error = (120.0- 117.5)/ 117.5* 100 = 2.1%


Two rarest species: 

  • Striped Maple density was 17.5 stems/ha whereas the calculated density was 4.0 stems/ha.

The percent error = (4.0 – 17.5)/ 17.5* 100 = 77.1%

  • White Pine density was 8.4 stems/ha whereas the calculated density was 16 stems/ha.

The percent error = (16.0 – 8.4)/ 8.4   * 100 = 90.5%

Total time to sample: 12 hours, 55 minutes


  1. Did the accuracy change with species abundance?

The accuracy was lower for the rarest species when compared to the species that were more abundant.

  1. Was one sampling strategy more accurate than another?

Systematic Sampling was the more accurate method and Haphazard Sampling was the least accurate.

Blog Post 4: Sampling Strategies (Robyn Reudink)

Systematic sampling was slightly faster than the other sampling techniques – taking a total of 12 hours & 4 minutes. Whereas both the random and haphazard sampling techniques took a total of 2 hours & 41 minutes.  This is likely because the quadrats in the systematic sampling technique are laid out in a linear transect, which potentially reduces the amount of time that is spent walking between quadrats.

The percent error of the different strategies for the 2 most common species, Eastern Hemlock & Sweet Birch and the 2 least common species, Striped Maple & White Pine, are outlined in the attached table. The random sampling technique was the most accurate of the strategies, as it had the lowest percent error for all species. For all of the sampling strategies, the accuracy was on average higher for species that were more common in the study area, than less abundant species.

Table – blog post 4

Blog Post 4: Sampling Strategies

Create a blog post describing the results of the three sampling strategies you used in the virtual forest tutorial. Which technique had the fastest estimated sampling time?

Systematic sampling was found to be faster than random or haphazard sampling. Systematic sampling took 12 hours and 35 minutes, random sampling took 13 hours and 50 minutes, and haphazard sampling took 12 hours and 54 minutes.

Compare the percentage error of the different strategies for the two most common and two rarest species.

Systematic Sampling:

Two Most Common Species:

Eastern Hemlock density actual was 469.9 versus 388.0 calculated is a 17.4% difference.

Sweet Birch density actual was 117.5 versus 148.0 calculated is a 20.6% difference.

Two Rarest Species:

Striped Maple density actual was 17.5 versus 40.0 calculated is a 56.2% difference.

White Pine density actual was 8.4 versus 20.0 calculated is a 58% difference.

Random Sampling:

Two Most Common Species:

Eastern Hemlock density actual was 469.9 versus 496.2 calculated is a 5.3% difference.

Sweet Birch density actual was 117.5 versus 107.7 calculated is an 8.3% difference.

To Rarest Species:

Striped Maple density actual was 17.5 versus 7.7 calculated is a 56% difference.

White Pine density actual was 8.4 versus 3.8 calculated is a 54.8% difference.

Haphazard Sampling:

Two Most Common Species:

Eastern Hemlock density actual was 469.9 versus 484.0 calculated is a 2.9% difference.

Sweet Birch density actual was 117.5 versus 140.0 calculated is a 16.1% difference.

Two Rarest Species:

Striped Maple density actual was 17.5 versus 32.0 calculated is a 41.7% difference.

White Pine density actual was 8.4 versus 8.0 calculated is a 4.8% difference.

Did the accuracy change with species abundance?

Both systematic and random sampling had greater accuracy with species abundance. However, haphazard sampling resulted in both the most common and rarest species having greater accuracy.

Was one sampling strategy more accurate than another?

Random sampling can be more accurate than systematic due to periodic ordering. However, haphazard had greater accuracy, which may be due to increased homogenous communities, leading to a greater community representation.

Blog Post 4 – Sampling Strategies

For the tree sampling program, the three different sampling methodologies chosen were area-based random, systematic, and haphazard sampling. The most efficient methodology was random sampling, which was 20 minutes faster to complete compared to haphazard sampling (12 hours 8 minutes versus 12 hours 28 minutes). Systematic sampling was the most accurate for estimating diversity, with a Shannon-Wiener diversity index value of 1.5, which is the same at the true value. Random sampling was the least accurate, with a value of 1.3

The two most common tree species in the study area are eastern hemlock and sweet birch. Systematic sampling was the most accurate in estimating density of eastern hemlock, with a percentage error of 11.5% compared to random (18.4%), and haphazard (21.5%). Random sampling was the most accurate in estimating density of sweet birch, with a percentage error of 0.08% compared to haphazard (6.4%) and systematic (21.7%).

The two most rare species in the study area are striped maple and white pine. Both random and systematic sampling methodologies failed to record this species, while haphazard was fairly accurate in estimating density with a percentage error of 4.6%. All methodologies were poor at estimating density of white pine. Systematic was the most accurate with a percentage error of 90.5%, while haphazard had a percentage error of 247.6%. Random sampling failed to record this species.

The accuracy of density estimates declined the more rare the tree species were. Twenty-four sample points were likely not a sufficient number as multiple methodologies had large discrepancies between estimated and actual densities of multiple species, while some methodologies failed to record some species at all.

Blog Post #4 – Virtual Forests Exercise

Of the systematic, random, and haphazard sampling techniques used, I noted that each method presents its own advantages and disadvantages. For example, the systematic sampling strategy appeared to be the most straight-forward and least time-consuming method, but only focused on a centralized area of the landscape. The random and haphazard methods presented as very similar (especially because I opted to use no bias in my haphazard site selections) and appeared to be more complex, labour-intensive, and time consuming than the systematic method. However, these methods appeared to give a more complete picture of the landscape as the samples were not limited by any criteria, save for chance (which can unfortunately not work in our favour at the best of times, it seems).

I was under the impression that the sampling times would greatly vary, but was surprised to find that the estimations generated by the virtual program were marginally different. The sampling methods clocked in at the following times:

  • Systematic: 12 hours, 36 minutes
  • Random: 12 hours, 53 minutes
  • Haphazard: 12 hours, 37 minutes

I was unsurprised to find that the systematic method was estimated to be the fastest, but was even more surprised to find how close the haphazard method measured in. Regardless, I feel that the random and haphazard sampling methods could be highly variable due to the randomness of how sites are selected.

When examining accuracy, I had assumed that the random sampling method would be best, which, judging by the data comparisons appeared to have been somewhat correct.

The percentage error for the two most common tree species measured as:

  • Eastern Hemlock
    • Systematic: 17.4% error
    • Random: 19.7% error
    • Haphazard: 16.1% error
  • Sweet Birch
    • Systematic: 38.7% error
    • Random: 18.5% error
    • Haphazard: 41.9% error

The percentage error of the least common tree species measured as:

  • Striped Maple
    • Systematic: 60.0% error
    • Random: 4.6% error
    • Haphazard: 4.6% error
  • White Pine
    • Systematic: 100% error
    • Random: 100% error
    • Haphazard: 1.2% error

Overall, the random method appeared to be the most accurate sampling method for measuring the most abundant species, while the haphazard method appeared to be the most accurate when measuring the least abundant species. With all things considered, the random and haphazard sampling methods appear to be the most accurate and holistic methods to use, even though they are more time consuming than the systematic method.


Percy Herbert, Blog Post 4: Sampling Strategies

The three sampling techniques used in the virtual forest tutorial were haphazard, random, and systematic. There are advantages and disadvantages to each of the three sampling techniques. For each of the techniques 25 area quadrats were observed. For haphazard sampling 5 quadrats were selected from each of the 5 topographical regions by trying to hand select quadrats representative of the average tree density in each region. For random sampling a random list of 25 coordinates were generated and those quadrats were observed. For systematic sampling a transect which crossed the entire sampling area, passing through all topographical regions was used. Quadrats were observed on alternating sides of the transect.

The quickest sampling method was systematic sampling at 12 hours and 36 minutes. This makes sense as there is little time spent walking between quadrats as they are all located in a linear line. Haphazard (13 hours 2 minutes) and random (13 hours 13 minutes) sampling both took longer than systematic sampling due to the distance between observed quadrats.

Systematic sampling was the most accurate sampling method for the 2 most common tree species (Eastern Hemlock and Red Maple). Systematic sampling had an error of 5% for Eastern Hemlock  density and 25% for Red Maple density, both lower than haphazard (14% and 51% error respectively) and random sampling (17% and 32% respectively). This result is expected as systematic sampling forces the observer to follow a preset system during sampling eliminating the possibility of the observer biasing the samples as can occur during haphazard sampling. Systematic sampling is also a more accurate predictor of the frequency of the two most abundant tree species then random sampling as 5 quadrats are selected from each topographical area. Random sampling allows for quadrats to be selected from any topographical region without any constraints on topographical regions.

Accuracy was better for all 3 sampling techniques for the higher abundance species then for the lower abundance species. Error for the density of the two least abundant species (Striped Maple and White Pine) were 60% and 100% for systematic sampling, 77% and 52% for random sampling, and 31% and 52% for haphazard sampling respectively. A small change in number of individual trees of a certain species can dramatically change the predicted density when the abundance is low. This is understandable as to get accurate results for the low abundance trees, more quadrats would need to be observed.

For predicting densities of tree species in this study it appears that systematic sampling has given the most accurate results. However, even with the use of systematic sampling, more quadrats must be observed if the densities of the lower abundance species are to be accurately predicted.

Blog Post 4: Sampling Strategies

I was surprised to see that all three sampling techniques showed marginal differences in time required to sample. Perhaps it was the way I performed the exercise, but systematic sampling (12h36m) was barely faster than random sampling (12h40m), which was also minutely faster than haphazard sampling (12h42m). I’m not sure how the simulation calculates estimated sampling time, but intuitively it seems like haphazard sampling should be the fastest method.

In terms of percent error, systematic sampling yielded the worst results for a common species (eastern hemlock, 15.4% sweet birch, 17%) and haphazard sampling yielded the worth results for rare species (striped maple, 200% yellow pine, 160%). Random sampling yielded the most accurate results for both common (7.7% and 6.5% error) and rare species (0% and 25% error).

I imagine in reality that haphazard sampling should be the fastest technique, with consistently inaccurate results for rare species and potentially accurate results for common species, that systematic sampling would be the second fastest technique, with marginally accurate results for both common and rare species assuming that environmental gradients are crossed, and that random sampling is consistently the most accurate but takes the longest.

Reudink, Post 4: Sampling Strategies

Which technique had the fastest estimated sampling time?

The systematic sampling technique had the fastest sampling time where 25 samples took 12 hours, 36 minutes.

Compare the percentage error of the different strategies for the two most common and two rarest species.

(most common to least common)

Systematic:

Eastern Hemlock (520.0-469.9)/469.9 * 100 = 10.7%

Sweet Birch (144.0-117.5)/117.5 * 100 = 22.6%

Striped Maple (44.0-17.5)/17.5 * 100 = 151.4%

White Pine (8.0-8.4)/8.4 * 100 = 4.8%

Mean percent error from above calculations = 47.4%

Random:

Eastern Hemlock (520.8-469.9)/469.9 * 100 = 10.8%

Sweet Birch (154.2-117.5)/117.5 * 100 = 31.2%

Striped Maple (41.7-17.5)/17.5 * 100 = 138.2%

White Pine (8.3-8.4)/8.4 * 100 = 1.2%

Mean percent error from above calculations = 45.4%

Haphazard:

Eastern Hemlock (504.0-469.9)/469.9 * 100 = 7.3%

Sweet Birch (140.0-117.5)/117.5 * 100 = 19.1%

Striped Maple (36.0-17.5)/17.5 * 100 = 105.7%

White Pine (4.0-8.4)/8.4 * 100 = 52.4%

Mean percent error from above calculations = 46.1%

Did the accuracy change with species abundance?

For the most part, yes. The most abundant tree, Eastern Hemlock, had a percent error ranging from 7.3-10.8% with a mean percent error of 9.6% across sample techniques. This was the most accurate mean percent error among all tree species. Interestingly though, the least abundant tree, White Pine, did not elicit the least accurate percent error across sampling techniques (PE = 19.5%). The least accurately measured tree species across sampling techniques wass the Striped Maple (PE = 131.8%).

Was one sampling strategy more accurate than another?

Based off the mean percent error of the two most abundant and two least abundant species, the random sampling strategy was the most accurate (mean PE = 45.4%)

Blog Post 4: Sampling Strategies

In the virtual forest tutorial, the fastest estimated sampling time was using systematic sampling at 12.6 hours. Haphazard sampling was a close second with 12.61 hours, a negligible difference. Random sampling was estimated to take about 45 minutes longer at 13.4 hours. All area based samples were used.

Haphazard sampling was more accurate for common species, with the lowest percent error (eastern hemlock at 2.8% vs. 18% and 17%) (red maple at 5% vs. 14% and 33%). Random sampling was more accurate for rare species, with the lowest percent error (striped maple at 8.5 % vs. 60% and 90%) (white pine at 4.8% vs. 100% and 100%). Systematic and haphazard completely missed white pine counts.

The overall accuracy trend appears to change with species abundance as seen in the graph below (figure 1), with more abundant species showing less error when sampling density. Random sampling was the most accurate with the lowest average percent error of 12.3% versus systematic and haphazard being both greater than 40%. Random sampling seems to be much more precise over the entire range of density’s, maintaining accuracy at lower density values although requiring a longer sampling time (Table 1).

Figure 1. Actual density vs. percent error of sampling methods.
Table 1. Actual density and sampling method data for tree species in the virtual sampling tutorial.