In the virtual forest tutorial, using the area-based method for samples taken in the Snyder-Middleswarth Natural Area, the data collected in the haphazard method had the fastest estimated sampling time of 12 hours, 26 minutes.
From the collected data set we can gather that the most common species is Eastern Hemlock and Red Maple. The actual density for each is 469.9 and 118.9, respectively. The data set for the systematic sampling method provided the lowest percent error for each species at 4.7% for Eastern Hemlock and 2.4% for Red Maple. Conversely, the random sampling method resulted in the largest percent error at 25.5% for Eastern Hemlock and 120.8% for Red Maple. Comparatively, the rarest species sampled, the White Pine and Striped Maple held different results. The data set for haphazard sampling resulted in the smallest perfect error at 1.2% for White Pine and 18.9% for Striped Maple. Interestingly, both White Pine and Striped Maple concluded to the same largest percent error through random sampling at 100%.
It is notable that overall, the higher the actual data of species and collected data of species presented results with lower percent error. The average percent error for Eastern Hemlock was 13.7%. However, the rarest species, White Pine, had the next lowest percent error at 41.2%
The data set collected resulted in the systematic sampling method having the smallest percent error overall at an average of 10.8%, which was closely followed by the haphazard sampling method at 11.6%.
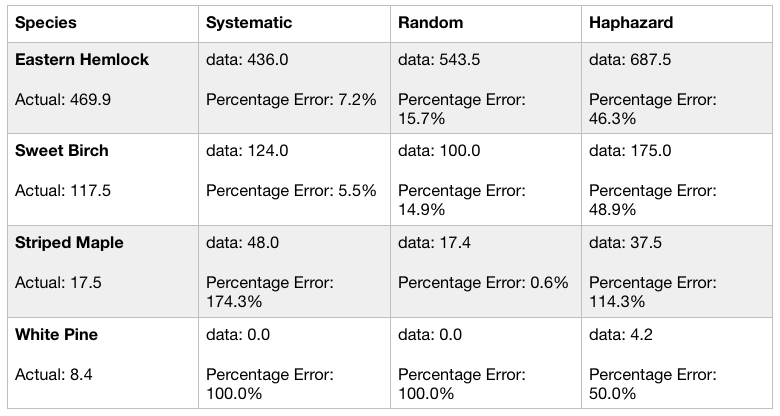
Table 1: Summary Data Set of Snyder-Middleswarth Natural Area Comparing Density with Area-based Methods
| Species |
|
Systematic |
|
Random |
|
Haphazard |
|
|
Actual Density |
Data |
Percent Errora |
Data |
Percent Error |
Data |
Percent Error |
| Most Common: |
|
|
|
|
|
|
|
| Eastern Hemlock |
469.9 |
448.0 |
4.7% |
350.0 |
25.5% |
520.8 |
10.8% |
| Red Maple |
118.9 |
116.0 |
2.4% |
262.5 |
120.8% |
137.5 |
15.6% |
| Rarest: |
|
|
|
|
|
|
|
| White Pine |
8.4 |
8.0 |
4.8% |
0.0 |
100.0% |
8.3 |
1.2% |
| Striped Maple |
17.5 |
12.0 |
31.4% |
0.0 |
100.0% |
20.8 |
18.9% |
| Estimated Sampling Time |
|
12 hours, 41 minutes |
|
12 hours, 45 minutes |
|
12 hours, 26 minutes |
|
aThe calculation used in finding the value of percentage error for each category is:
(E – T)/T*100, where E = estimated value and T = true value
Table 1 contains the summary for my findings for each species, eastern hemlock, red maple, white pine, and striped maple through systematic, random, and haphazard sampling in the Snyder-Middleswarth Natural Area. The table compares actual density of each species to the gathered data I found during sampling and the amount of time it would take to produce these samples.