Using the area-based method for community sampling I found the systematic technique to be have the fastest estimated time at 12 hours 35 minutes. In my virtual sample, systematic sampling also had the lowest combined percent error for both the two most common and the two least common tree species.
The most common tree species was Eastern Hemlock, the most accurate result for density was achieved using a systematic approach with a percent error of 14.02%. The second most common species was Red Maple, the most accurate technique for density was achieved using random sampling at 2.44%.
The least common species was White Pine, haphazard sampling achieved the lowest result in percent error for density at 52.38%. The second most rare species, Striped Maple, had an accuracy that was the same between systematic and haphazard sampling at 54.29%.
Accuracy was higher for the common species and much lower for rare species as shown in Table 1. The varying results between all the techniques and the inaccuracies shown through the large percent errors indicates that my sample size was too small. Larger sample sizes would be needed to achieve reasonable results.
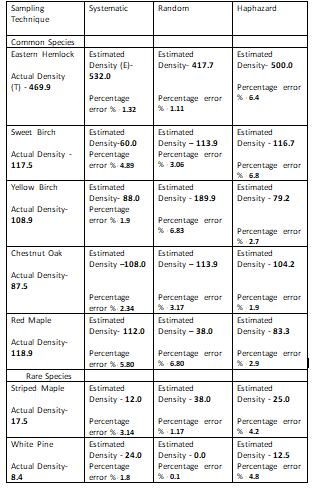
Table 1. Summary data for community sampling exercise comparing density using area-based methods.
| Species | Systematic | Random | Haphazard | ||||
| Actual density | data | Percent error | data | Percent error | data | Percent error | |
| Eastern Hemlock | 469.9 | 404.0 | 14.02% | 592.0 | 25.98% | 544.0 | 15.77% |
| Red Maple | 118.9 | 128.0 | 7.65% | 116.0 | 2.44% | 140.0 | 17.75% |
| Striped Maple | 17.5 | 8.0 | 54.29% | 0.0 | 100.00% | 8.0
|
54.29% |
| White Pine | 8.4 | 0.0 | 100.00% | 28.0 | 233.33% | 4.0 | 52.38% |
| time | 12 hours 35 minutes | 13 hours 22 minutes | 12 hours 57 minutes | ||||