Post 4: Sampling Strategies

The 3 sampling methods I used were area based random or systematic (1) , area based haphazard (2) and distance based haphazard (3). The forest I sampled was the Snyder-Middlesworth Natural Area.

The distance haphazard method was the fastest sampling time at 57 minutes, while both area based sampling methods took 2 hours and 36 minutes.

Percentage errors for 2 rarest species:

Chestnut Oak

  1. 37.4%
  2. 54.6%
  3. 100%

Striped Pine

  1. 357.7%
  2. 100%
  3. 100%

Percentage errors for 2 most common species:

Eastern Hemlock

  1. 36.2%
  2. 31.9%
  3. 52.2%

Sweet Birch

  1. 36.1%
  2. 36.1%
  3. 122.8%

The most accurate sampling method for the 2 rarest species was the haphazard method and the most accurate for the 2 most common species was the random or systematic method.

Overall I found the most accurate sampling method was the haphazard method (area or distance based).

Blog Post #4: Sampling strategies

The three sampling strategies I used in the virtual forest tutorial are Systematic, Random and Haphazard techniques.

I used area based methods to compare among the sample placement strategies. Please find here below, the tables demonstrating the collected sampling data collected on Snyder-Middleswarth Natural Area Community.

Among the three techniques, the Systematic sampling had the fastest estimated sampling time of 12 hours and 36 minutes; whereas Random sampling estimated time was 12 hours, 44 minutes; and 13 hours for the Haphazard sampling method.

Among the two most common species: Eastern Hemlock and Sweet Birch, Haphazard sampling technique was relatively the most accurate giving the lowest percent error of 12.3% for Eastern Hemlock and 25.9% for Sweet Birch.

Random sampling technique gave the lowest percent error for Sweet Birch, 25.5%, which is very close to Haphazard sampling technique; and the second lowest percent error of 16.6% for the Eastern Hemlock species.

In all the three techniques, Systematic sampling seem to be the least accurate due to the highest percent errors in the most common species, 17.4% for Eastern Hemlock, and 28.7% for the Sweet Birch.

The two rarest species appeared to be the Stripped Maple and White Pine. In both Systematic and Random sampling technique the percent error values for the White Pine species is 100% because none of the White Pines were present in the selected samples. Similarly, the percent error is 100% in Stripped Mapple species using the Random sampling technique. However, the percentage error was the lowest, 31.4% in Stripped Maple species using the Haphazard technique; and 60% percent error using the Systemic sampling method. Lastly, the highest percentage error observed was 280% of the White Pine using the Haphazard sampling method.

According to the data above, the overall accuracy is higher in the most common species, and lower in the rarest species in all sampling techniques. So the more abundant the species, the higher the accuracy.

Overall the Haphazard sampling technique was relatively the most accurate of the three techniques.


Blog Post #4

In the virtual forest tutorial, I chose Mohn Mill as my community sample. I chose to do area-based sampling using haphazard, random, and systematic methods. The haphazard method of sampling had the fastest estimated sampling time at 14 hours and 48 minutes, followed by the systematic method (16 hours and 59 minutes), and the random method (18 hours and 13 minutes).

Percentage errors of the two most abundant species:

Red Maple:

  • Haphazard- 2.68%
  • Random- 8.20%
  • Systematic-11.5%

Chestnut Oak:

  • Haphazard-2.90%
  • Random-2.05%
  • Systematic-5.08%

Percentage errors of the two least abundant species:

White Pine:

  • Haphazard- 100%
  • Random- 54.4%
  • Systematic-53.9%

Downy Juneberry:

  • Haphazard-44.0%
  • Random- 53.9%
  • Systematic- 57.0%

It is clear from the data that the more abundant species were more accurate than the less abundant ones. Overall, the random method was most accurate, followed by systematic, and then haphazard. Although haphazard sampling is more time efficient, it is not as accurate as the other two methods. It surprised me to see that haphazard sampling was the most effective for common species and that random/systematic sampling was most effective for uncommon species. I would expect haphazard sampling to be more effective for less common species, as samples are chosen subjectively. I would expect systematic sampling to be most effective for common species. My surprising results are likely due to my not taking enough samples before collecting and analyzing the data or poor choices when choosing quadrants to sample.

Blog Post 4: Sampling Strategies

I conducted area-based systematic, random and haphazard sampling methods on the Snyder-Middleswarth Natural Area in the virtual sampling tutorial. Eastern Hemlock (EH) and Sweet Birch (SB) were the most common species found in my simulation, while Striped Maple (SM) and White Pine (WP) were the rarest.

Systematic sampling was performed on 25 quadrats over an estimated duration of 12hrs37mins. The percent errors for EH, SB, SM and WP were 11.47%, 21.70%, 100% and 90.48%, respectively.

Random sampling was performed on 24 quadrats over an estimated duration of 12hrs57mins. The percent errors for EH, SB, SM, and WP were 29.39%, 17.02%, 90.29% and 100%, respectively.

Haphazard, or subjective, sampling was performed on 24 quadrats over an estimated duration of 12hrs40mins. The percent errors for EH, SB, SM and WP were 28.58%, 6.38%, 76% and 197.62%, respectively.

Estimated sampling times were comparable across all three methods; however, systematic sampling had the lowest time and included an additional quadrat, making it the most efficient strategy in this simulation. In terms of accuracy, the margin of error was consistently, and considerably, lower among common tree species (EH & SB) as compared to rare tree species (SM & WP). This finding suggests a decrease in sampling accuracy when dealing with rare tree species.

In this simulation, systematic sampling was the most accurate for two out of the four tree species (EH & WP) and the least accurate for the other two species (SB & SM). Random sampling was never the most accurate method of sampling but it was only the least accurate for EM, by a very small margin (0.81%). Finally, haphazard sampling was the most accurate strategy for two out of the four tree species (SB & SM) and the least accurate method for WP, by a substantial margin (97.62%).

While the results from this simulation are inconclusive, I submit that systematic sampling was the most accurate. It was at par with random sampling for rare tree species, but slightly outperformed it when sampling common tree species. Furthermore, while haphazard sampling yielded the lowest result among the findings (6.38% error for SB), this sampling technique generally yielded inconsistent results. Increasing sample size in future simulations would improve accuracy across all three sampling methods.


Post 4: Sampling Strategies


  Systematic  Random  Haphazard 
Fastest estimated sampling time  12 hrs 38 mins  12 hrs 45 mins  12 hrs 30 mins 
Percentage error Eastern Hemlock   

((520-469.9)/469.9)) *100 

10.7% 


((479.2-469.9)/469.9)) *100 

1.98% 

((583.3-469.9)/469.9)) *100 

24.1% 

Percentage error Sweet Birch   

((124-117.5)/117.5)) *100 

5.5% 


((120.8-117.5)/117.5)) *100 

2.8% 

((166.7-117.5)/117.5)) *100 

41.9% 

Percentage error Striped Maple  ((0-17.5)/17.5)) *100 

100% 


((12.5-17.5)/17.5)) *100 

-28.6% 


((20.8-17.5)/17.5)) *100 

18.9% 

Percentage error White Pine   

((4-8.4)/8.4)) *100 

-52.4% 


((0.0-8.4)/8.4)) *100 

-100% 

((20.8-8.4)/8.4)) *100 

147.6% 

Accuracy  Moderate accuracy for common species 

Poor accuracy for least common species 


High accuracy for common species 

Poor to very poor accuracy for least common species 


Poor accuracy for common species 

Moderate to very poor accuracy for least common species 


Of the three sampling types, haphazard had the fastest sampling time but only marginally. It was 8 minutes faster than systematic sampling and 15 minutes faster than random sampling. I would expect random sampling to have the longest estimated sampling time as this can be a difficult method to carry out under field conditions. None of these estimated sampling times would give me enough information to choose which sampling method would be appropriate for a given project to reduce time costs. Possibly with a larger sample size (>24) the estimated sampling times would show greater variance amongst the sampling methods, providing better information to make a decision for project cost. 

To calculate percentage error, I based this calculation on the information provided for density (not frequency or dominance). The percentage error for the two most common species (Eastern hemlock & sweet birch), haphazard had the highest percentage error for the sampling method. This is to be expected because the plant community is more heterogeneous which tends to offer more biased, unrepresentative estimates. Random sampling offers reliable estimates with the least amount of bias and as a result, had the smallest percentage error for the two most common species. 

The two least common species had large variations in accuracy of density. The percentage error for density may be showing such variations as White Pine and Striped Maple are typically small species in terms of basal area (or diameter at breast height). This would cause a disproportionate representation of density and it may have been a better idea to calculate percentage error on dominance and not density. Dominance provides the total basal area of a given species within the unit area of the community. 

Species abundance does not appear to heavily influence percentage error accuracy in my findings, it only affects the result from overestimates and underestimates. Possibly with a larger sample size, this error would be greatly reduced. Using a species-area graph would have helped with sample size, ensuring that species richness is represented but once the graph starts to level off (no more addition of new species) no more additional samples are needed. 

Random sampling had the greatest time estimate but it also had the highest accuracy for the density of common species. I also appreciate the lack of bias in this method and would tend toward this sampling method. 


Blog Post 4-Sampling Strategies

Blog Post 4: Sampling Strategies

Using three sampling strategies in the virtual forest tutorial for the Snyder-Middleswarth Natural Area, the “simple random” sampling technique yielded the fastest sampling time. I would consider more than 24 plots, as I feel more data might yield more accurate results. I feel that the accuracy of the abundance is not enough to form any conclusions-I would increase the number of sample points for both.

(E-T)/E*100=percentage error

Rarest Species:

Eastern Hemlock Distance: Simple random Distance: Systemic Distance: Haphazard
PERCENTAGE ERROR 53% 3% 25%
Sweet Birch Distance: Simple random Distance: Systemic Distance: Haphazard
PERCENTAGE ERROR 84% 82% 11%


Most Common Species:

Striped Maple


Distance: Simple random Distance: Systemic Distance: Haphazard
PERCENTAGE ERROR 105% 100%


8%
White Pine Distance: Simple random Distance: Systemic Distance: Haphazard
PERCENTAGE ERROR 327% 100%


100%


The most accurate sampling method was haphazard for both the rarest and the most abundant.  Accuracy appears to decrease with species abundance.

The haphazard method appears to yield more accurate results. While the times vary considerably:

Random: 1 hour, 24 minutes

Systemic: 4 hours, 59 minutes

Haphazard: 4 hours, 31 minutes

I might consider the random technique if I had a small team and a large distance to cover.

Blog Post 4- Sampling Strategies

Blog Post 4:

For this sampling exercise, I studied the 154-ha Mohn Mill area located within Pennsylvania at elevations that range between approximately 420 to 570 m ASL. Steeply dipping slopes make up the topography of the area and sandy loams cover the slopes. During the sampling exercise, I used three techniques that included systematic, random, and haphazard sampling. The results from the three sampling methods are as follows and show percent error data from the two most common and most rare trees.

Using random sampling methods Red Maple (RM) and Witch Hazel (WH) came up as the most dominant species. After 20 quadrats were sampled percent error for each showed errors of 1.98% and 26%, and a total time of 10 hours and 33 minutes was taken to sample. The two most rare species were black cherry (BC) and American basswood each having errors of 566% and 566% respectively.

Using haphazard sampling methods RM and WH came up as the most dominant species. After 20 quadrats were sampled percent error for each showed an error of 14.14% and 49%, and a total time of 10 hours and 34 minutes was taken to sample. The two most rare species were downy juneberry (DJ) and BC each having errors of 201% and 233% respectively

Using systematic sampling methods RM and WH came up as the most dominant species. 24 quadrats were sampled and systematically spaced 50 quadrats from one another. Percent error for each showed an error of 4.21% and 37%, and a total time of 12 hours and 22 minutes was taken to sample. The two most rare species were DJ and white pine and white pine each having errors of 57% and 67% respectively

Observing the results shows that RM and WH are the most common species. Out of the three methods random sampling produced the least percent error (1.98%, 26%), and I suggest that this is the most accurate method. RM appeared to have the lowest percent error in all three methods (1.98%, 14.14%, 4.21%). This could be an artifact from the actual data and more current analysis may have to be undertaken. Another observation includes percent error increasing with diminishing abundance of species with BC (566%, 233%) and DJ (201%, 57%) having the largest error and least recorded abundance. This concludes that accuracy in all three methods increases with the availability of species to sample and random sampling was the most accurate method for sampling. Moreover, systematic sampling took the longest to complete and haphazard and random took similar amounts of time.

Blog Post 4 – Sampling Strategies

For this blog post, I used an online community sampling exercise to sample Mohn Mill. I used three techniques, systematic sampling, random sampling, and haphazard sampling. The most efficient sampling technique was random sampling, taking approximately 11 hours and 51 minutes in comparison to the other techniques taking over 12 hours. The two most common species were the Red Maple and the White Oak, and the two rarest species were the White Ash and Yellow Birch. The percentages are listed below for comparison. The accuracy of the tests varied widely between the common and rare species, the common species having errors as low as 1.33%, and the rare species having errors as high as 1037.5%, the accuracy declining significantly with the rare species. In general, random sampling method had the lowest percent error for both common and rare species, excluding the White Ash. The most accurate of the common species was the random sampling of the Red Maple, with percent error of 1.33%. The most accurate of the rare species was significantly worse, from all sample methods of the Yellow Birch with a percent error of 100% across the board. I think 24 sample points is enough to capture the number of species in this density, but it would not hurt to have more data to further confirm conclusions made. I think that 24 sample points is not enough to accurately estimate the abundance of these species, as the percent error for the rare species was astronomical in comparison to that of the common species and more data is needed to capture more accurate numbers for the rare species. 

RM random- 8%

ROM syst – 1.33%

RM hap – 7.12%


WO ran – 34.33%

WO syst – 46.44%

WO hap – 39.87%

YB ran – 100%

YB syst 

TB hap

WA ran 100%

WA syst 1037.5%

WA hap – 937.5%

Post 4: Sampling Strategies

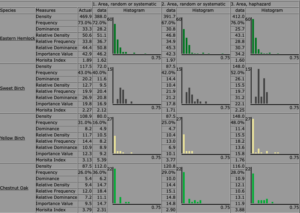
In the virtual forest tutorial, a systematic sampling method, a simple randomized sampling method, and a haphazard sampling method were used to determine the frequency of seven tree species. The systematic sampling method involved randomly selecting a point along the southern margin of the study area and running a transect, straight north, through the five topographical regions (Southern Ridge Top, North Facing Slope, Bottomland, South-Facing Slope, and Northern Ridge Top). Samples were then taken from 24 quadrats (alternating between the eastern side and western side of the transect) until the northern margin was reached. The simple randomized sampling method involved generating 24 random locations to collect data. Finally, my haphazard method of sample collection involved attempting to space the quadrats in such a way that they maximized the distance between each other and the edge of the study area.

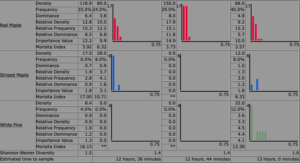
Based on the estimated sampling times, the haphazard method proved to be the fastest method (12:17 hrs) of sampling, and the simple random sampling method ended up being the slowest (12:45 hrs). However, I think it is worth noting that the systematic sampling method was, anecdotally, the fastest to conduct in the simulation and it seems logical that it should be considerably faster that either of the other two methods. This is because it covered much less walking distance than the random and haphazard method.

The two most common species in the study area were eastern hemlock and red maple. For eastern hemlock, the haphazard sampling method yielded a 6.9% error, the systematic sampling method yielded a 13.2% error, and the random sampling method yielded a 26.4% error. For red maple, the haphazard sampling method yielded a 17.0% error, the systematic sampling method yielded a 5.1% error, and the random sampling method yielded a 5.9% error.   In both cases, the systematic method was more accurate than the random method, and the haphazard varied from being the best and the worst method.

The two most rare species in the study area were striped maple and white pine. For striped maple, the haphazard sampling method yielded a 100% error, the systematic sampling method yielded a 31.4% error, and the random sampling method yielded a 42% error. For white pine, the haphazard sampling method yielded a 98% error, the systematic sampling method yielded a 185% error, and the random sampling method yielded a 49% error.   The systematic sampling method was most accurate for the striped maple; however, the random method wasn’t far off. In the case of the white pine, the systematic sampling method was extremely inaccurate and the random method was the most accurate. The haphazard method was extremely inaccurate in both cases.

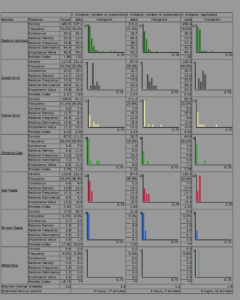
Overall, the haphazard method out-performed the other methods for four out of the seven species. However, it was extremely inaccurate with determining the frequency of rare species and red maple. The inconsistent percent error values of the haphazard method lead me to believe that this method has value; however, it is a risky sampling strategy. I believe that the success from my haphazard approach is likely derived from traits that it took from a stratified method. By choosing points that were relatively far away from each other, I, incidentally, chose a similar amount of points in each region (Southern Ridge Top, North Facing Slope, Bottomland, South-Facing Slope, and Northern Ridge Top). Similarly, the systematic method performed well in most cases but had a lot of challenge with the rare species. Therefore, even though the random sampling method only outperformed both other methods in one case, it was the most consistent for determining the frequency of common and rare species.

Blog Post 4

For this tutorial I used the distance-based methods for sampling in the Snyder-Middleswarth Natural Area. In looking at the results of the three different sampling methods used for this exercise, the fastest estimated sampling time came from using random sampling method.


1)Simple Random

  • Eastern Hemlock- (537.1-469.9)/469.9 *100 =14.3%
  • Sweet Birch – (121.6-117.5)/117.5 *100 = 3.5%
  • Striped Maple – (30.4-17.5)/17.5 *100 = 73.7%
  • White Pine = (0-8.4)/8.4 *100 = 100%

2) Systematic

  • Eastern Hemlock = (310-469.9)/469.9 *100 =34%
  • Sweet Birch = (87.4-117.5)/117.5 *100 = 25.6%
  • Striped Maple = (31.8-17.5)/17.5 *100 = 81. 7%
  • White Pine = (0-8.4)/8.4 *100 = 100%

3) Haphazard

  • Eastern Hemlock = (490.4-469.9)/469.9 * 100 = 4.4%
  • Sweet Birch = (129.5-117.5)117.5 *100 = 10.2%
  • Striped Maple = (9.3-17.5)/17.5 * 100 = 46.9%
  • White Pine = (9.3-8.4)/8.4 *100 = 10.7%

The most accurate sampling strategy for the most common species and least common species was haphazard sampling. For the second most common species the most accurate sampling method was simple random, and for the second least common species the most accurate was haphazard. In all three methods the accuracy dropped as species abundance dropped. Surprisingly, haphazard sampling appears to be the more accurate strategy in this situation. However, I do not understand why an estimated value would ever be exactly 0. Would there not always be a slight chance of the above species occurrence regardless of sampling method?