Blog post 1 – Observations

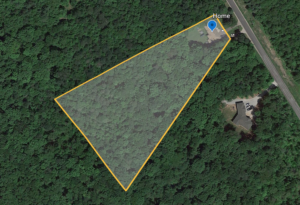
The study site for the study was within a 3-km radius at the Stanford University near Palo Alto California. As indicated, the site selected represents the urban-semi-urban environment which would be ideal for the study. The sites for the study included a biological preserve, the open space recreational area, the golf course, the residential area, the office park as well as the business district. The area of choice is a mixture of both urban and semi-urban making it an urban-semi-urban area making it highly appropriate for the study. The interaction of people, animals amongst other living and non-living organisms with the environment is interesting hence making the area ideal for the research.  The area is fascinating due to the landscape (hills, valleys and wetlands) and the different organisms therein. The topography allows for the different organisms to thrive and coexist hence creating a unique ecosystem within the region. The different topography could have different species and diverse interactions of the organisms that exist therein.

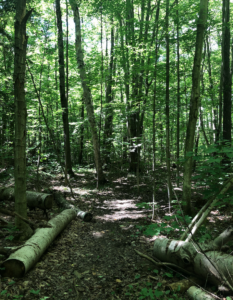
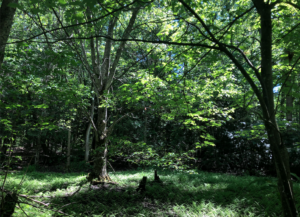
These differences would enable dynamic research in terms of the different organisms and ecosystems within the area. A diversity that exists seamlessly within the ecosystem. There are several potential case studies that would include the different types of birds, crops, plantations, wetlands, and insects especially butterflies and bees. The area is covered by various trees that are each different but bring forth an aesthetic view and surroundings. The potential subjects I would want to study different crops from the different areas of study.

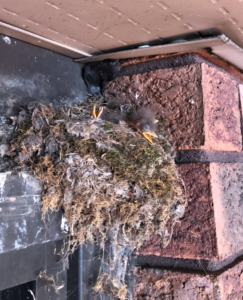
The study will help answer different questions which include; what is the difference in the tree species and varieties in different locations? How is human encroachment and settling affecting the different species and diversities of the trees within the area? Is acidic rain and other climate change variants affecting the growth and development of trees within the different locations and environments? Some of the questions to also be asked include: what are the different characteristics of birds in the different areas of study? Does the environment change have an effect on the population of birds in the different topographical locations?


Blog post 2 – Sources of Scientific Information

The sources of information for the study would include botanical books that are in the library. The information documented therein would help understand the evolution of the vegetation especially trees within the Palo Alto area. There are various books within the library that not only show the history of the Palo Alto vegetation. They are unchangeable and were written by people who inhabited or visited the area at different times in history. Understanding the history of the trees from the perspective of other botanists would come in handy in ensuring the data collection and analysis are done effectively rather than using guesswork. The books also provides education and lessons on the different species hence making it easier to correlate the different types of trees within the ecosystem. Additionally, peer reviewed articles would be a great source of information that would connect the past to the present hence help project the future and becoming a guide for the study. The articles contains information that peers within the ecological field have found or rather discovered over time. Most of these articles have been verified to be useful especially those that have been published in google scholar amongst other scholarly sites. Therefore, becoming a basis for understanding and developing the hypothesis and the thesis.  Published articles within the university’s environmental magazines and journals would also come in handy. These articles not only contains the various tree genus but also informs of the possible changes that occur in the tree plantations and distributions not only within the campus but also outside.

Another source of information for the study was a scientific research article and the types of information presented is academic peer-reviewed review material. This is because the information is published by the Ecological Society of America and made available on JSTOR, a digital library which was founded in 1995, in the United States (“Terms and Conditions of Use | About JSTOR,” n.d.).

Reference

Terms and Conditions of Use | About JSTOR. (n.d.). Retrieved September 1, 2020, from https://about.jstor.org/terms/

Blog Post #9

There were a few bumps along the road as I designed and carried out my field experiment. I changed my hypothesis and experimental design multiple times in order to better suit the goal of my research. I struggled to really narrow down exactly what it was I was looking for and what I was predicting. There seemed to be so many connections and not enough time to explore them all. However, I was finally able to pinpoint my hypothesis and come up with a straightforward prediction. Before I completed this course, I had little to no experience in carrying out field research. Engaging in the practice of ecology has helped me to appreciate how much effort goes into the development of ecological theory. It is much more complex and difficult than I had originally assumed. I am sure that the skills I gained and the information I learned during this research project will help me as I continue my degree. 

Blog Post 5: Design Reflections

My initial data collection day went as planned and I was able to implement my sampling strategy with relative ease, despite plots landing in black hawthorn bushes and one plot that was inches away from a large hornets nest! I brought along an assistant (my wife) to help with note taking and tape measure holding which aided in the process.

The soil texture results were as I thought they would be with courses texture results on the steep slope section, with the exception of one plot out of a total of 20. Given my successful experience implementing my initial data collection I intend to continue subsequent data collection in the same way.

A possible modification I may make is the spacing of my plots and transect lines. Currently transect lines are spaced 10m apart with plots every 15m on each transect line. I insured that I evenly captured both the gentle and steep slope sections, however, I wonder if I should attempt to cover a larger total area. I could do this either by allocated more distance between transect lines and/or between plots.

Blog Post #5

I decided to study vegetation diversity with increasing distance from the creek in my home town. My hypothesis was that proximity from the creek would effect the variety of plant life growing in the area. I predicted that, as distance from the creek increased, the variety of vegetation would also increase. I predicted the heardier plants like the Cows Parsnip and grass would survive closer to the creek because they are typically able to survive in a variety conditions. They can grow in shade or direct sunlight and in damp areas as well as drier areas. Other species, such as the wild rose, needs to have a bit of shade as well as not be in areas that are too damp or too dry.

I focussed on the portion of the walking trail starting at 15th street and ending near the public library because the whole creek would be too large of an area for me to properly sample. I stratified the area by the creek into five different sections (t1-t5) as shown on my map below. I took eleven samples from each section. I used a random number generator app on my phone to determine how far I would have to walk in each section before placing my 1m^2 quadrat and sampling.

I stuggled with collecting my data for the areas closest to the creek as some areas were very steep and difficult to walk on. I was forced to estimate where I would be placing my quadrat from the top of some of the inclines because I couldn’t actually get down the slope to place it.

I counted how many different species types I found in each section:

T1-8

T2-8

T3-12

t4-8

t5-4

I was surprised to see that the first two sections didn’t have a higher number of species than the third. I wondered if this was due to the mowing and spraying the city does near the walking trail. This also could be due to the plants near the trail being in direct sunlight.

I think that my method of sampling is working for the most part. I would like to think of a more accurate way to smaple the areas nearest the creek but have yet to come up with a solution (if anyone has one, please let me know). Also, I will need to take more samples in each section. Some of the rarer species I listed didn’t get sampled even once. I found myslef walking past some common species every time due to random luck with the number generator. Taking more samples would give me a better idea of the diversity and abundance of the species in each transect.


Blog Post 8 – Tables and Graphs

My graph was fairly straight forward and compared the number of red alder present in my study area compared to the soil moisture reading of all quadrants. Soil moisture readings ranged from 0 to 6, with 0 being the least amount of moisture. The trend on my graph shows that as the number of red alder increases, the soil moisture reading increases as well. This graph supports my hypothesis that red alder require higher soil moisture, and is exactly what I had expected.

I did not have any difficulties organizing, aggregating or summarizing my data while creating this graph. After my graph was marked, I realized that I should have put my sample size in my graph description. I also should have averaged the number of red alder for moisture readings that were the same in more than one quadrant. My study had 30 quadrants total along 3 transects, and I only included readings for quadrants that contained red alder for this particular graph. There were 14 quadrants containing red alder, with 14 soil moisture readings, however many had the same readings therefore I had 7 total points on the graph for soil moisture. What I should have done is if two quadrants had the same moisture reading, but a different number of red alder, I would have to average the number of red alder. I also learned that graphs are not supposed to have titles, which will help me with my final report.

Blog Post 7 – Theoretical Perspectives

Three keywords that describe the underlying processes of my research project are water stress, microclimate and competition.

My hypothesis is that red alder require higher soil moisture. Through observation of my study site, I found that red alder were often found closer to the river, which lead me to believe that there is higher soil moisture in this area. Throughout my research, I have found a number of ecological processes that relate to my research project. Not only is there evidence that red alder live in areas of high soil moisture, but they have a tolerance to flooding and intolerance to water stress.

I theorize that the river provides a microclimate consisting of increased water availability, increased light availability, and is a slightly lower elevation than other areas in my study. These conditions allow red alder to thrive right along the river’s edge and creates the perfect microclimate to increase red alder abundance and survival.

Throughout my research, I have found that red alder are good competitors, and are often found in areas that have been disturbed. As the river changes throughout the season, it is likely that red alder are able to handle flooding and erosion better than other species in the area. This would allow them to live closer to the river’s edge, and give them the upper hand compared to other species that require more stable conditions.


Post 1: Observations

Blog Post 1

   The area I have selected for my field research project is an approximately 0.021204 km^2 stretch of land surrounding my house. Located in Springwater Ontario the area is flat and has a dense boreal forest that sustains a rich biodiversity of insects, small mammals, reptiles, and birds. The ganaraska trail runs through this area along with a few other man made hiking trails. There are very few houses nearby meaning that with the exception of the trails, there is little to no evidence of human activity. 

   There is a seasonal pond that is approximately 0.015 km^2 of still water which has now turned into a field of lady ferns. The area around the pond is flat which makes the ground damp and muddy. After thunderstorms, which are common during Ontario summers, the pond and surrounding area floods. 

My site
The trail
The pond turned to lady fern field

First Visit 

  • June 29th, 11:34,  28*C, sunny with some cloud coverage, humidity of 55%
  • 44.51604 N, 79.746865 W 
  • Springwater Ontario
  • Boreal forest


Wildlife:

  • Garter snake (Thamnophis sirtalis)
  • American robin (Turdus migratorius)
  • Eastern Wood-Pewee (Contopus virens)
  • Fowler’s Toad (Anaxyrus fowleri
  • Chipmunk (Tamis striatus)
  • Ruby Throated Hummingbird (Archilochus colubris)
  • American Goldfinch (Spinus tristis)
  • Spotted Salamander (Ambystoma maculatum)
  • Deer Mouse (Peromyscus maniculatus)


Vegetation:

  • Alternate-Leaf Dogwood (Cornus alternifolia)
  • Black Spruce (Picea mariana)
  • Eastern White Cedar (Thuja occidentalis)
  • Jack Pine (Pinus banksiana)
  • Sugar Maple (Acer saccharum)
  • Blue Beech (Carpinus caroliniana
  • Paper Birch (Betula papyrifera)
  • Orange Lily (Lilium bulbiferum)
  • Lady Fern (Athyrium filix-femina)


Notes:

  • The pond has optimal conditions for mosquitoes to breed
  • There are 2 new fallen trees after the most recent thunderstorm
  • The presence of the snakes has led to a noticeable decline in mice and toad populations around the house
  • Robins nest with 3 eggs approximately 3ft off the ground in an Emerald Green tree
  •  4 Garter snakes that live in our wood pile
  • Eastern Wood-Pewee nest with 4 hatchlings on the back deck
  • I lifted up a small log that was blocking the trail and underneath was a Spotted Salamander
  • Many Fowler’s toads on walk to the pond
Eastern Wood-Pewee hatchlings
Garter Snakes

Questions:

  1. How does the weather affect the snakes behaviour?
  2. How long does it take for the baby birds to leave the nest?
  3. Is the soil more fertile at the pond than it is around the house?

Blog post 4: Sampling Strategies

My results for the forest community Snyder-Middleswarth Natural Area are as follows:

My fastest estimated sampling time between all three strategies was area haphazard sampling at 13 hours, following with random sampling at 13 hours and 19 minutes, and longest estimated time with systemic sampling at 15 hours and 7 minutes.

Overall, the sampling strategy with the most accuracy for me was the area haphazard which really surprised me. Systemic sampling had the worst overall error percentage while the random sampling was in the middle. For the two most common species the most accurate to the least accurate sampling strategies was (1) random, (2) haphazard, (3) systemic. For the two rarest species we have, from most accurate to least, (1) haphazard, (2) random (3) systemic.

The accuracy for all strategies were best with common species and higher margins of error for the rarest species. Below are the statistics for the percentage error with each strategy.

Area Haphazard (most common to least common)

EASHEM: 16%

SWEBIR: 23%

STRMAP: 77%

WHIPIN: 90%

Area systematic

EASHEM: 48%

SWEBIR: 72%

STRMAP: 100%

WHIPIN: 100%

Area random

EASHEM: 9%

SWEBIR: 25%

STRMAP: 78%

WHIPIN: 100%

Blog Post 9: Field Research Reflections

Create a final blog post that reflects on your field research. You both designed a field experiment and then carried it out. Did you have any issues with the implementation or have to make any changes to your design? Has engaging in the practice of ecology altered your appreciation for how ecological theory is developed?

My appreciation for the detail and depth in ecology has been wildly expanded. I performed the simplest of experiments and even then, the amount of hours, work, thought and literature review accompanying it surprised me. I have definitely found a new appreciation for ecologists. My implementation of design was simple from the beginning, but as I was sampling I kept thinking of more and more factors that should have been considered and further experimentation that would need to be performed to have my research make any sense or be of accuracy.