BLOG POST 7

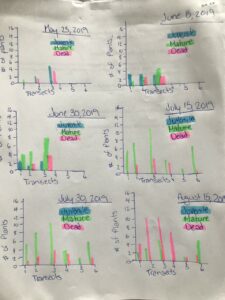
My main focus has been if there is a correlation between the number of pollinators and the weather. I have done this at a garden that has plant species that are to attract bees, therefore in theory there should be a fair number of bees in this general area. This can also tie in with the temperature of the day, the humidity, the wind, there are honestly all kinds of other factors that can affect the results. I am taking the temperature of the day and the type of weather into consideration when I am counting the number of pollinators in/ near the garden.

Three keywords for my research could be pollinators, botanical gardens, weather.

BLOG POST 6

I did eight replicates in total, all at the Bee Garden outside of the Ken Lepin building. I have had some issues with the spread-out area, with there being a fair amount of plants to keep my eye on and trying to ensure I do not miss any bees. I have noticed some slight patterns, such as there being a fair amount of bees the higher the temperature and with a lower temperature and rain there seems to be fewer bees.

Blog Post 8: Tables and Graph

I had no issues organizing my data. I began by creating 6 tables (1 for each site visit) and have the total number of plants found in each Transect and if they were juvenile, mature, or dead plants. Once I had this information down in organized tables it was much easier to create bar graphs of our findings. I have attached 1 table and a graphical representation of all 6 site visits and their findings. I was surprised of my findings in transects 4-6 during site visits 1-3. This is because Heracleum mantegazzianum is a very strong plant and can handle all sorts of conditions, hense why it has been so successful as an invasive species in North America. But as this is the furthest North it has began to reach in British Columbia, the chances are it just has not made it to the denser forest and higher altitudes at this time. 

Transect  Juvenil  Mature  Dead 
T1  0  1  0 
T2  3  0  2 
T3  6  0  4 
T4  0  0  0 
T5  0  0  0 
T6  0  0  0 
Total Mean  1.5  0.2  1 

(Table 1 – results of plants found on May 25th, 2019. Transect 1-3 are within Section 1 (disturbed sites) and Transects 4-6 are within Section 2 (natural site)).


Post 7: Theoretical Perspectives

My study examines the effect of sunlight exposure on density of Canada goldenrod (Solidago canadensis). I hypothesized that higher levels of light exposure would be better growing conditions for the goldenrod, and therefore would result in increased plant density. As such, my research primarily relates to the goldenrod’s germination process and its preferential growing conditions. Additional factors that will be considered are the effects of soil moisture, elevation, and competition with other vegetation.

Three Keywords: Sunlight exposure, plant density, Solidago canadensis

Blog Post 9: Reflections

In hindsight I wish I would have broadened my sample size as I was very limited. However, I believe I was able to gather enough data to conduct my experiment and felt that, while it was a simple design, it was a straightforward enough so that I could digest what was happening at the pace I was comfortable with. For the future I hope to become more confident in creating a design that can be expanded upon and not remain so limited.

Blog Post 4: Sampling Strategies

I started the tutorial using the area-based model for all three of the sampling techniques. There was not too big of a difference between the duration of the samplings, but I found the fastest of the three techniques to be using the haphazard technique (14 hours). I found that the haphazard technique yielded the more accurate sampling error when it came to rare species, whereas the systematic approach was better in determining percent error results for the two common species. In terms of effectiveness of techniques, the haphazard provided better results, compared to the systematic and random approaches.


Blog Post 8: Graphs and Tables

Creating a graph to represent the collected data went smoothly as it was easy to represent the total amount of sunlight graphically for each day I spent observing. I created a separate graph for the individual days I collected data, and then combined them in a bar graph that represented the combined amount of time for each marking. Once again, the data supported my initial hypothesis as the markings that contained Seedling 2 averaged the most sunlight exposure. The markings that contained Seedling 1 averaged the least exposure whereas the markings containing Seedling 3 was only slightly lower than that of Seedling 2.


Blog Post 7: Theoretical Perspectives

The purpose of my study was to investigate the effectiveness of seedling growth based on exposure to sunlight. Other topics that could be considered in this investigation could include competition over resources between seedlings, and the proximity of neighbouring trees and shrubs that may also create competition for the seedlings. I predicted that increased exposure to sunlight was the cause of Seedling 2’s (the seedling most exposed to sunlight) faster growth rate, and so far the data collected is in support of my initial hypothesis.


Keywords: seedling growth, exposure to sunlight, competition of resources


Blog Post 6: Data Collection

So far data collection has been going smoothly as the plots chosen have provided effective measurements of the amount of sunlight hitting each seedling at the different hour increments of the day. From my observations, each 5″ segment receives sunlight at some point of the day regardless of the shadow casted by my house, the shed, and the adjacent tree canopy, suggesting that the points chosen are able to yield enough data to support the initial hypothesis. I have noticed that the plots that contain Seedling 2 and Seedling 3 receive the most sunlight during the early morning 8:30 AM – 9:30 AM time slot, whereas Seedling 1 only receives sunlight during the mid afternoon 12:30 PM – 13:30 PM time slot. Seedling 2 remains exposed to the sun throughout all three time slots and continues to signs of steady growth as it remains the tallest in height with its branches continuing to support the most leaves.

Blog Post 5: Design Reflections

Data collection has been going well due to convenient access to the study area. I have been gathering data on the seedlings every Friday in three time intervals to measure amount of sunlight. Because I am limited to only three specimens for this study, I chose to use haphazard sampling using replicates of marks labeled A,B,C,D,E, spaced 4 inches from each other along  a line following the base of the root connecting each seedling. I collect data in the morning from 8:00 AM – 9:00 AM, then again at 12:30 PM-13:30 PM when the sun is right above the seedlings, then again at 16:30 PM-17:30 PM. The data collected was not surprising as it supports my initial hypothesis that Seedling 2 will receive more sunlight.