Blog Post 3: Ongoing observations

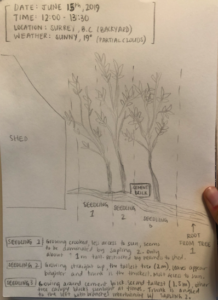
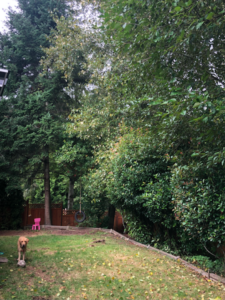
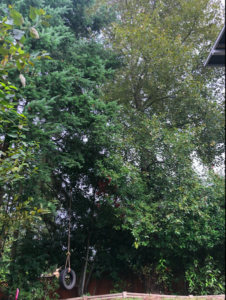
I chose to study the three populus thrichocarpa (common name, black cottonwood) seedlings that stemmed from the largest tree. I will be comparing the height and quality of bark and leaf health between all three seedlings. While connected to the same stem, all three seedlings have different surrounding environments that affect access to sunlight. I have observed that the middle seedling (seedling 2) has the thickest trunk and is the highest of all three. Seedling 2 also has the greatest access to sunlight as Seedling 1 and Seedling 3 both have obstructions in the form of canopy created by adjacent larger trees and a tool shed. Seedling 1 and Seedling 3 also have slightly curved trunks and are noticeably shorter than Seedling 2.


Hypothesis: I hypothesize that Seedling 2 will have the most successful growing period.

Prediction: I predict that greater access to sunlight will allow Seedling 2 to grow at a faster rate than the other two seedlings.

Predictor variable will be access to sunlight (continuous) and the response variable will be the growth in height of each seedling.  Explanatory variables could be the nearness to the shed or adjacent trees as these could both impede growth (categorical).

Blog Post 2: Sources of Scientific Information

I chose an online article titled “Hydroclimatic drivers of the growth of riparian cottonwoods at the prairie margin: River flows, river regulation,, and the Pacific Decadal Oscillation” written collectively by Laurens J. Philipsen et al. This article was published in the month of October 2018 through the Dendrochronologia journal which is an interdisciplinary journal of ring-tree science. This article sheds light on the dependency of riparian cottonwood trees on sources of groundwater and their sensitivity to climate change. I would classify this article as an academic peer-reviwed article as it was written by experts in the field, with affiliations with the University of Lethbridge. On the title page, it is mentioned that the article was sent for review on August 14th 2018, before being accepted on August 19 2018, meaning that it wen through a revision process before being published. This article also posses a Methods section, Discussion section, and a bibliography deeming it fit to be used for research purposes. I gained a better understanding of how cottonwood trees absorb nutrients and the level of sensitivity they have towards the environment.


Philipsen L.J., Pearce D.W., Rood, S.B., (2018). Hydroclimatic drivers of the growth of riparian cottonwood at the prairie margin: River flows, river regulation, and the Pacific Decadal Oscillation, 51:82-91.

Blog Post 1: Observations

I chose to observe the cottonwood trees in the backyard of my childhood home. Our yard is 100×30′, located in the suburbs of South Surrey British Columbia. There are two cottonwood trees among the fauna in our backyard that I chose to observe. There are also two Douglas fir trees, that surround the largest cottonwood and smaller shrub plants that line the floor of the tree dominated area.  The tallest cottonwood is approximately 80′ high, and has recently began to sprout a younger tree 5m from its trunk. Both cottonwood trees have been spreading their roots throughout the yard, with many of the roots emerging from the soil. We first witnessed the roots emerging about three years ago, and now they have taken spread throughout the majority of the yard.

I began my observations on June 1st, 2019 at 3:00pm. The temperature was 22 degrees celsius, with very few clouds interrupting the sun. I have split the yard in two 50’x10′ sections as the cottonwood trees are conveniently located on opposite ends of the yard.

The three questions that came to mind during my observations were:

  • Are the surrounding plants of each cottonwood tree affecting access to nutrients?
  • Is the younger trees growth success due to its nearness to what was an old vegetable garden?
  • Which cottonwood tree supports the most wildlife?

Blog Post 7: Theoretical Perspectives

My research project is primarily about the best habitat (disturbed or natural) for Giant Hogweed (Heracleum mantegazzianum), and the variation of soil types in which it thrives in. The ideas connected to my research are why does it grow in mainly in disturbed sites, how is it spreading to these sites, and what can we do in British Columbia to manage and mitigate the spread of Giant Hogweed.  My research has a special focus on the effects of the growth of Giant Hogweed to the surrounding native environment (ie: harming biodiversity by shading native plants or its effects on riparian areas).


Invasive Plant Species, inter-specific competition, population density

Blogpost 6: Data Collection

Collecting samples in the field has been fairly easy, so long as the proper amount of time has been allocated to collect them. In total, 450 replicates were taken using a 0.25m2 quadrat. These samples were taken randomly and in equal numbers throughout the three zone types as outlined in my experimental design; canopied forest, uncanopied forest, and open grassland. A total of 9 sampling regions were sampled, with 50 samples taken from each. Three of these regions were in open grassland, three were canopied forest, and three were uncanopied forest (Figure 1).


No major issues were encountered when implementing my sampling design (other than many mosquitos!).


So far, it appears that the grassland samples have a higher occurrence of Knapweed than in either of the forest zones; this would support my hypothesis that access to sunlight affects the growth frequency of Knapweed. Statistical analysis has yet to be done on the data.

Figure 1. Satellite view of natural area; uncanopied area not accurately represented due to
age of image (google maps). Rough sampling zones outlined; 50 random samples taken per sampled zone. Project total n= 450.


EDIT: A new data collection method was used following this blog post. 10 transects were sampled with 21 samples each, taken 10m apart along each transect (n=210). This new collection method cut the time needed to collect samples by a considerable margin. A 1m xx 0.5m quadrat was used to sample for presence/absence of Spotted Knapweed (Centaurea maculosa). See figure 2 for an updated design layout in the natural area to the South of residential Aberdeen, Kamloops.


Similarly, to the previous sampling method, grassland cover seems to have a higher frequency of Knapweed than either of the other two cover types. Data analysis still needs to be conducted to confirm the significance of this pattern.

Figure 2. ________. Natural area including walking trail south of residential area in Aberdeen, Kamloops. Coordinates for trail and trail head are 50° 38’ 1” N 120° 21’ 18” W. Elevation ranges from 860m at the bottom of transects (at trail level) to 935m at the top of transects. Transects are drawn in yellow, the walking path highlighted in red, and a blue length marker is included for reference; ten transects were sampled for presence or absence of Spotted Knapweed (Centaurea maculosa) and cover type (canopied forest, partially lit forest, open grassland) every 10m (total transect length 210m). Transect spacing was randomly chosen using a randomizer phone app. (total n=210).

Blogpost 4: Sampling strategies

The sampling strategy in the virtual forest tutorial that had the fasted estimated sampling time was haphazard sampling. For one of the two rarest species, White Pine, haphazard sampling had the most accurate results with a 1.2% error. The other rarest species, Striped Maple, has no accurate sampling strategy with this tutorial (all sampling strategies had >100% error).

For the most common species, Eastern Hemlock, systematic sampling narrowly beat out random sampling with 20% error (compared to 20.6% random sampling). For the second most common species, the Red Maple, systematic sampling had a much wider margin on accuracy with a 32.7% error (as opposed to 53% for both other strategies).


Species abundance did not seem to have a massive effect on accuracy; the lowest percent error was for a rare species. This leads me to believe more replicate samples should be done in a study like this for a better representative sampling.


Overall, it seems that a systematic sampling strategy had the lowest percent error for more species than the other two sampling strategies. Haphazard sampling yielded the lowest percent error for a few species and random samples did not produce the lowest percent error for any of the species in the tutorial.

Blogpost 3: Ongoing field observations

The organism which I plan to study is the distribution of Spotted Knapweed, Centaurea biebersteinii.

The Knapweed plants have light purple flowers with thin and extending petals. The stalk is light-green, thin, and does not cover a lot of horizontal space. Each plant may have multiple flowers and stands 1 to 2 feet tall, generally speaking. The Knapweed plants seem to grow both in patches and also individually.

In each of the three stratum types, forested, forested with minimal/no cover, and open grassland, the physical features of each plant appeared similar. The distribution between areas is different, however. The Knapweed is virtually non-existent in the forested area; however, in areas of forest with no cover, Knapweed seems to grow in large patches as well as regularly by themselves. In the open grassland, Knapweed does not grow in patches, rather, it grows individually and often.

Processes that may play a part in this observed pattern could be access to sunlight, or competition with other species. Soil type is fairly uniform throughout this entire mountainside region, and precipitation is fairly rare in arid Kamloops this time of year.

Because of these observations, I hypothesize that Knapweed will grow more frequently in areas with more access to sunlight; if a stratum has more access to sunlight, then Knapweed will grow in greater frequency than in other stratums.

A response variable could be Knapweed frequency (continuous), or perhaps Knapweed density (continuous), and a explanatory variable could be access to sunlight (can be set up categorically or continuously).

Knapweed.

Blog post 2: sources of scientific information

I reviewed the article Late-Season Survey of Bumble Bees Along Canadian Highways of British Columbia and Yukon Territories. The article was found using TRU’s online database and the topic and abstract seemed interesting to me.


  1. a) The source of this article is the Western North American Naturalist journal. (https://ezproxy.tru.ca/login?url=https://search-ebscohost-com.ezproxy.tru.ca/login.aspx?direct=true&db=a9h&AN=109305710&site=eds-live)
  2. b) The article in an academic, peer-reviewed, research article.
  3. c) This article is academic as it is written by experts in the field who are employed for ecological research groups and government agencies; in-text citations and a bibliography are present in the article. The article is peer-reviewed as evidenced by the inclusion of both ‘received’ and ‘accepted’ dates; googling the journal’s website shows that it is a peer-reviewed publication. Lastly, the article is a research article as data was collected by the authors and both a methods and a results section were included.


Blog Post 6 – Data Collection

The field data that I have been collecting over the past few months has been duplicated 6 times and we are reaching the end of the Giant Hogweed life cycle for this season. Though noted in the assignment that I would duplicate this 2 times, I have found more time to duplicate the data collection.  The sampling size being used is throughout the data collection period is randomly selected areas and then a 5-meter radius will be observed in the efforts of collecting information. These areas where chosen systematically random, by starting at the high disturbed area and working our way to the back of the property low disturbance area. Six sites where sampled 3 being in the high disturbance area and 3 being in the low disturbance area. The patterns I’ve noticed is that the Giant hogweed is growing along ‘trails’, road side, driveway, game trail through the tall grass, etc. And there are no Giant hogweed growing between the transition area (where the high and low disturbance change) and 0 plants growing in the low disturbance area. I believe this is due to such a high crown cover in the low disturbed area, making it very shaded.

Blog post 5: Design Reflection

During my data collection in the field, the systematic sampling strategy proved to be efficient at surveying the area. The few difficulties I encountered during the sampling did not damage the quality of my data in any way. First, the determination of transects was simple, but keeping that transect straight as I collected my subsamples across the field seemed to be a challenge. For the last three transects, I established three or four checkpoints along each transects in order to keep me straight. Having closer targets greatly improved the quality of my transects. Secondly, making my way along a transect turned out to be slightly more challenging than I expected. The vegetation got pretty dense in some portions of the field. I always managed to make my way through it but I had to push through some plants and small shrubs. Applying the quadrat down never was an issue. I would simply drop it over the vegetation of the area, however tall or dense that was.

The data was not surprising to me. These first samples even seem to play in favour of my initial hypothesis – more flowers appeared as I sampled away from the beach. One noticeable aspect of my data was that all types of flowers seemed to be displayed in clusters.

I think that my systematic approach to survey the site was the best option. The data collection was performed with minimal difficulties that were all overcame to maintain the essence of the systematic method. It eliminates the possibility of bias, and more samples will only add to the reliability of my data.