Recent Posts

Blog Post 3: Ongoing Field Observations

User:  | Open Learning Faculty Member: 


July 13th / 2021 10:30 am

Temperature: 18 degrees C, overcast conditions

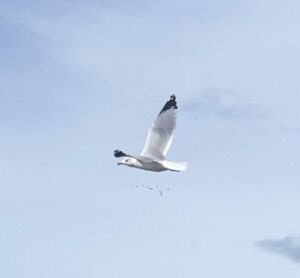
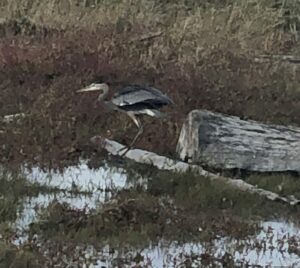
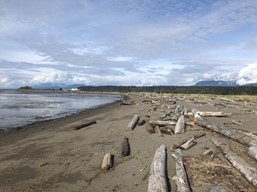
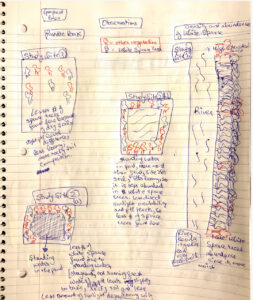
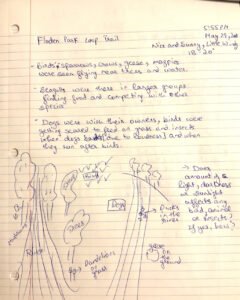
I plan on studying the behavior of birds at various locations at the Esquimalt Lagoon. At the first chosen location which is a shallow water marshy area with freshwater run off there was a family of ducks, a single seagull, 2 American Golden-Plover, 1 crow and 2 House Sparrows. I stood at the spot for ten minutes and waited for birds to appear in the areas. The second location is on the other side of the lagoon which opens to the ocean. The birds observed on that side were 2 seagulls at the rocky shoreline looking for food under the seaweed that was washed up. The third spot chosen along the environmental gradient is an area to the right of the marshy region which has more bushes and trees for birds to land on. The birds observed in the bushes were a flock of House Sparrows approximately 10 of them.

Considering the distribution of the different types of birds I notice a pattern on the types of species that are found in each region more frequently than the other. In the first location it was observed that there were ducks, seagulls, crows and more species by or in the water, the second location strictly seagulls at the ocean shore and the third location had House Sparrows which were perched in the trees. Not every spot had the same bird species found throughout. I hypothesize that the bird species are spread out through the environmental gradient based upon what their lifestyle needs require;  types of vegetation and prey that includes small animals, insects and fish.  Ducks for example are mainly insectivores and herbivorous so their diets require them to be in areas where there is vegetation and insects on the water. This will occur in areas that are shallow and marshy compared to the open ocean. The potential response variable is the number of bird species that appear in each chosen location over a ten minute period, this is considered categorical because I am categorizing individual species. One potential explanatory variable could be the types of vegetation found in each location which would fall under categorical as I am identifying the species present.

Blog Post 2: Sources of Scientific Information

User:  | Open Learning Faculty Member: 


What the source is: This is an unpublished report found online by the professional Biologist and Ecologist Nick Page of Raincoast Applied Ecology. This report, written by an expert in this field, advocates for natural resource management with suggestions for shoreline and vegetation restoration at Iona Beach Regional Park in Richmond, B.C.. The following is a link to the report PDF online.

http://www.raincoastappliedecology.ca/wp-content/uploads/2012/05/Iona-Beach-Vegetation-Management-Report-March-20111.pdf

Source Type Classification: Non-peer reviewed academic material

Documentation supporting classification: By following the flow chart provided by the Module 1 Tutorial: How to Evaluate Sources of Scientific Information, reading the report, and researching the Raincoast Applied Ecology company webpage, it became clear that this report is in fact academic in nature. However, as there was no mention in the Acknowledgements section, and the suggested citation indicated so, it has not undergone peer review or publishing. Additionally, this report contains both in-text citations and a References list, but no methodology was carried out. As such, this report must be classified as non-peer reviewed academic material.


References

http://www.raincoastappliedecology.ca/company-profile/

http://www.raincoastappliedecology.ca/wp-content/uploads/2012/05/N-Page-Short-Resume-Jan-2012.pdf

https://barabus.tru.ca/biol3021/evaluating_information.html#1

Blog Post 1: Observations

User: user | Open Learning Faculty Member: Robyn Reudink


Date: 19-07-21

Time: 5:50-9:17 pm

Location: Iona Beach Regional Park, Richmond, B.C., Canada

Coordinates: 49.2168° N, 123.2049° W

Weather Conditions: 26 degrees Celsius; sunny and clear, occasional cloud; light breeze (SE 17 km/h); relative humidity of about 42%

Topography: coastal sand ecosystem on a peninsula located about 5 km north of YVR international airport and 10 km southeast of the University of British Columbia campus.

Species: Large-headed Sedge (Carex macrocephala); Dune wildrye (Leymus mollis); Blue heron (Ardea herodias); Bald eagle (Haliaeetus leucocephalus); common sea gull (Larus canus)

Observations: Upon arrival, the tide had already begun receding from the high of 3.12 m at 2:14 pm towards the low of 1.09 m at 8:29 pm. The beach is composed of sand flats with sparse vegetation and shrubbery, slowly descending into where the Fraser river runoff meets the Pacific ocean (estuary). Iona beach is also located along the Pacific Flyway, thus the diversity of bird species visible here year round is incredible. Many large-headed sedges everywhere. Lots of tracks appearing to be from dogs observed in the sand—possibly coyotes too? Many layers to the vegetation including sand, small vegetation such as sedges and dune wildrye, shrubs, washed up and decomposing drift wood.

common sea gull, Larus canus.

Blue heron, Ardea Herodias.

Large-headed Sedge, Carex macrocephala.

Sand flats of Iona beach, sloping into the estuary where the Fraser river meets the Pacific ocean.

Important Reminders: Bring binoculars next time to observe bird species more closely, and a ruler or tape measure to measure vegetation and animal tracks. Wear close-toed shoes—sedges hurt!

Being interested in the ecology and conservation of both the plant and animal life at this lovely beach, I believe this location would perfectly suit my field project for this course. As I continue to visit, I will take more detailed observations and measurements of the surrounding vegetation to understand how the gradient changes from the upper shrubbery and dune wildrye to the lower algae and estuary species found nearer the water. I look forward to working on this project and gaining a deeper knowledge of the natural history and ecology of this beach.

Blog Post #3 Ongoing Field Observations (Robyn Reudink)

User:  | Open Learning Faculty Member: 


I am keenly interested in birds, small mammals, plant vegetation and mushrooms, however the organism or biological attribute that I plan to study would be on the density and abundance of white spruce (Picea glauca).

I went to Rundle Park, which is a municipal park, located at 2909 113 Ave NW, Edmonton, T5W 0P3, Alberta. I chose this park since it is quite bigger in area and has better sites to collect data and test my hypothesis. It’s total area is 0.82km^2 (0.32 sq. mi.) and elevation is 654m, with coordinates 53.563° N 113.392° W.

The three locations that I chose are:

Site 1: Forested area beside River

This location was right beside the river and I noticed that there were a lot of white spruce trees densely packed. The abundance and distribution was relatively high at this site. This was high elevated area with longer periods of direct sunlight available to them. The soil composition is ideal for the growth and abundance of spruce trees which was damp and moisty. It had lesser rocks when compared to other sites. The soil was loamy (sandy and clay).

Site 2: Near standing water (ponds area)

There were lots of little ponds in the Rundle park, with standing water. Some of the ponds had very clean water and some were not that much and had stagnant water. I noticed that the abundance and distribution was moderate at this site as there were fair amount of white spruce seen. Spruce found in this site were lesser in quantity compared to Site 1, probably because of the standing water ponds that were not that clean and fresh (stagnant). The soil was well moist, little rocky and not that loamy. There was less direct sunlight degree available. So observed few trees there.

Site 3: The park entrance area

The park entrance area did not have that many number of spruce trees comparative to the other location sites. One of the reasons I think is soil moisture and sunlight availability. The area was little dry and was rocky and less loamy in soil composition, so slighter number of spruces will grow.

My hypothesis is that the density and abundance of White Spruce is positively affected by soil moisture, light availability (shaded or direct sunlight), the degree of sunlight, pH levels of soil (little acidic) and soil type (sandy and clay soil) collectively.

My prediction is that the density and abundance of White Spruce is positively affected by soil moisture, light availability (shaded or direct sunlight), the degree of sunlight, pH levels of soil (little acidic) and soil type (sandy and clay soil) communally.

I might as well add how the soil depth level and specific soil pH level affects the growth of white spruce trees in my research paper including all study sites.

The potential response variable for my hypothesis is the abundance of white spruce trees. So, It is continuous.

The potential explanatory variable for my hypothesis is the soil composition, moisture and sunlight availability. It is continuous.


Blog Post#2 (Robyn Reudink)

User:  | Open Learning Faculty Member: 


For sources of scientific information, the ecological article that I chose is, “Habitat loss and fragmentation affecting mammal and bird communities—The role of interspecific competition and individual space use.” This is an online article that I found using TRU library. Here is the link to this interesting article:

Carsten M. Buchmann, Frank M. Schurr, Ran Nathan, Florian Jeltsch; Habitat loss and fragmentation affecting mammal and bird communities—The role of interspecific competition and individual space use, Ecological Informatics, Volume 14, 2013, Pages 90-98, ISSN 1574-9541, https://doi.org/10.1016/j.ecoinf.2012.11.015. (https://www.sciencedirect.com/science/article/pii/S1574954112001252)

It is classified as an academic, peer-reviewed research material. This article is written by an expert in the field, which includes bibliography and in-text citations in the end section, which makes it an academic material. Field study has been done in the methods section of the article, demonstrating it is peer-reviewed. In acknowledgment section,  N. Blaum and E. Rosmanith and other members were thanked for reviewing this article before publishing it, meaning it is peer-reviewed. It has nice and detailed section where it mentions the results of the study and methods authors used in the article, so it is an academic, peer-reviewed research material.


Blog Post#1 Observations (Robyn Reudink)

User:  | Open Learning Faculty Member: 


May 29, 2021 at 5:55 PM

The area that I selected is a city park that is not so far from my place, called Floden Park Loop Trail ,situated at 4209 111 Avenue NW, Edmonton,  Alberta. Its approximate size is around 1.2 km and 23 m elevation. It is a loop trail park with lots of vegetation, river (water body), forested frees, bird, walking trail and small animals. I visited this park at 5:55PM on May 29, 2021 and the weather was nice, sunny and warm and little windy, 18-20 degrees.

The potential subjects I want to study based on my observations are following:

I observed the profusion of small animals such as squirrels, rabbits and birds, for example, a medium sized black bird, (probably black billed magpie), crows, geese and small sparrows (maybe Boreal Chickadee). I noticed all these around the trees and on the ground near water, feeding on grass, earthworms, flowers (dandelions, sunflower, etc.), seeds, fruits, other small insects, mushrooms near river (beside vegetation near water body) and some on the trees, on fallen tree logs and some around the roots of the trees. Some of the birds were fighting and competing for food. They might have nests in those trees or laid eggs there. I was questioning why dandelions are found everywhere on the ground as I have seen them almost everywhere even in the school parks near me. I was also thinking about the diversity and abundance of mushrooms as they were noticed and are there any poisonous mushrooms in the city. I saw bracket fungi, Jelly fungi and coral fungi. I also saw small holes digged in the park, illustrating presence of rabbits and squirrels. There were many dogs too with their owners (some running after birds). I am interested in researching about birds (especially geese, terns, seagulls and black billed magpie), mushrooms and trees. The grass and trees are fully grown. The questions includes:

  • What do these birds usually eat for the survival of themselves and their young ones and how many hardships and challenges they have to face during it?
  • What migratory birds are seen often here in this area and how are they adapted to the weather, food and other conditions to the place where they migrate and is there any competition or predation that they face within the species or from diverse bird species? How do they cope with it? Does the location makes any impact on their number, biomass and density?
  • What kind of tree species are found here the most, any principal species and how are they beneficial to other organisms and is there any mutualism or commensalism found in the ecological community where they are located?
  • What factors help in sustaining the abundance and diversity of fungus and mushrooms in the biological area? What are the different types of mushrooms?
  • Evaluate on the distribution of density dependence among birds, insects or smaller mammals?


Blog Post 9: Field Research Reflections

User:  | Open Learning Faculty Member: 


As mentioned in previous posts, I initially had a challenging time executing my research design, as my study site was washed out due to flooding. I found another site which ended up being a better selection, as my study object, polypore fungi, were far more numerous than at the original location. The process of collecting samples and studying the substrates was a very enjoyable experience, minus the unbelievable amount of bugs. (I feel for any ecologists conducting field work in northern Canada in the summer).

The correlation between my variables (quantity of bracket fungi and soil moisture) was weak based on the data I collected which was frustrating. I think all ecologists hope to discover a satisfyingly strong connection between their predictor and response variables, and I am no exception! This experience has taught me a lot about the challenges of conducting field research, and the necessity for rigorously assessing and accounting for a wide range of confounding variables. It was somewhat naive of  me to think that a correlation would be found simply by counting bracket quantity per tree and measuring the soil at the tree base. I see now that many other factors need to be considered in a multivariate analysis and that a much larger sample size should be collected for such a study.  Such a study would also benefit from being repeated over multiple seasons and years to assess for changes in polypore growth and soil moisture potentials.

This experience has given me a new appreciation for the complexities and frustrations of ecological research, as the nebulous interactions of biotic variables make ecology less straightforward than other scientific disciplines. Developing an ecological theory is a daunting task because it is very difficult to make any definitive conclusions when endless variables need to be considered and generalities cannot necessarily be made from one region to another.

Blog Post 7: Theoretical Perspectives (Robyn Reudink)

User:  | Open Learning Faculty Member: 


For my research project I studied the growth rate of sunflower plants based on two different watering regimes, including: a high-water and a low-water treatment group. In the high-water volume application treatment, the plants received a total of four times the amount of water, then the low-water treatment group. The sunflowers were grown over a 40-day period and weekly measurements of the shoot height and the maximum basal diameter (mm) were collected for each plant. My hypothesis is that the growth rate of the sunflower plants, measured by the shoot height and the maximum basal diameter, will be influenced by the water availability/ treatment. My prediction is that the average size of the sunflower plants (Helianthus annuus) will be smaller in the low-water volume treatment group when compared to the high-water volume treatment group. The ecological process that relates to my research is the influence of water levels (or water stress) and their relationship to measures of plant growth.

Keywords: plant growth, water stress, soil moisture

Blog post 4: Sampling Strategies

User:  | Open Learning Faculty Member: 


  • The technique with the fastest estimated sampling time was the systematic sampling technique which took 12 hours and 35 minutes for 25 samples. However, the random sampling method did not significantly differ in its time frame when compared to the systematic sampling technique. The difference between the systematic and random methods was 9 minutes.


  • Systematic sampling method:


Two most common species:


Eastern Hemlock ® (564.0-469.9)/469.9 * 100 = 20.0%


Sweet Birch® (52.0-117.5)/117.5 * 100 = 55.7%


Two least common species


Striped Maple® (16.0-17.5)/17.5 * 100 = 8.6%


White Pine® (12.0-8.4)/8.4 * 100 = 42.3%


  • Random sampling method


Two most common species:

Eastern Hemlock® (433.3-469.9)/469.9 * 100 = 7.8%


Sweet Birch® (87.5-117.5)/117.5 * 100 = 25.5%


Two least common species

Striped Maple® (20.8-17.5)/17.5 * 100 = 18.6%


White Pine® (25.0-8.4)/8.4 * 100 = 197.6%


  • Haphazard method


Two most common species:


Eastern Hemlock® (492.0-469.9)/469.9 * 100 = 4.7%


Sweet Birch® (64.0-117.5)/117.5 * 100 = 45.5%


Two least common species

Striped Maple® (16.0-17.5)/17.5 * 100 = 8.6%


White Pine® (12.0-8.4)/8.4 * 100 = 42.3%


  • The accuracy did change with species abundance. The accuracy decreases as the abundance of a species decreases.


  • The most rare species identified as the “White Pine” had a percentage error difference of 42.3% for both the systematic and haphazard method ruling the random method with a percentage difference of 197.6% as the least accurate method. Since the systematic method is the least time-consuming method it is considered overall the best and most accurate method to use.


Blog post 3: Ongoing Field Observations

User:  | Open Learning Faculty Member: 


  1. Identify the organism or biological attribute that you plan to study.


The study I am conducting will focus on the abundance of Boxelder Maple tree species and the relationship between their increase in abundance as the distance towards the riverbank decreases.


  1. Use your field journal to document observations of your organism or biological attribute along an environmental gradient. Choose at least three locations along the gradient and observe and record any changes in the distribution, abundance, or character of your object of study.


Locations for study


  • Location one: “Riparian Area”

This are is located N/E using the parking lot as a reference point. It is a riparian area along the riverbank of the Red River with a sidewalk on the outskirts measured at 353.18 m. There is a very high abundance of Boxelder Maple trees beside the sidewalk and as I walked my way towards the river I noticed a few other tree species with low abundance such as Buroak and Arborvitae tree. Alongside the riverbank, there also seemed to be a high abundance of Boxelder Maple trees.


  • Location 2: “mini-forest”

I chose this area since it is the furthest area away from the Red River lake. I saw some White Spruce trees, a high abundance of Jack Pine trees, a low density of Boxelder Maple trees.


  • Location 3: “Forest next to River” but further away from the Riverbank when compared to location 1

As I walked from the off-leash dog area towards the direction of the river, there was a high abundance of White Spruce trees, some White Willow trees and as I got closer to the river there was an increased abundance of Boxelder Maple trees.


  1. Think about underlying processes that may cause any patterns that you have observed. Postulate one hypothesis and make one formal prediction based on that hypothesis. Your hypothesis may include the environmental gradient; however, if you come up with a hypothesis that you want to pursue within one part of the gradient or one site, that is acceptable as well.


Boxelder Maple trees dominate the area near the river. There are many reasons that can cause boxelder Maple trees to dominate the area near the river. One potential reason could be that it could be a natural area and since it is distant from other tree species such as Jack Pine trees it could have not been disturbed. In other areas of the park, Jack Pine trees dominate the area which could mean that it is an invasive species. Another potential reason could be their need for water. Boxelder Maple trees might require a higher amount of water in order to survive which is why they are found near the river and since trees have deep roots, they could be using the river as an additional source of water. The soil near the riverbank is the same level of dryness; therefore, soil moisture is not likely to be a potential reason for their abundance.


Hypothesis: Boxelder Maple trees is higher in abundance in areas near the river than areas further away from the river.


Prediction:

Boxelder Maple trees are more likely to be found in areas near the river than areas further away from the river.

Boxelder Maple trees require a higher concentration of water in order to survive.


  1. Based on your hypothesis and prediction, list one potential response variable and one potential explanatory variable and whether they would be categorical or continuous. Use the experimental design tutorial to help you with this.


Response Variable: Abundance of Boxelder Maple trees (Continuous measure).


Explanatory Variable: Distance from the Red River lake (Continuous measure).


Since both variables are continuous, this suggests that this study would require regression analysis for its experimental design.