Recent Posts

Blog Post 7: Theoretical Perspectives

User:  | Open Learning Faculty Member: 


The hypothesis of my research involves determining whether the presence of other plant species growing near an individual bean (Phaseolus vulgaris) plant contributes to its growth and abundance. I want to understand whether greater diversity in garden plots reduce the intraspecific competitions; thus, resulting in larger bean plants. The ecological processes that my hypothesis might touch on include the biotic factor such as competition, mainly the intraspecific, but also interspecific competitions. Other ecological processes to be explored include the abiotic factors such as soil moisture, water balance and nitrogen fixation. The species richness in biodiversity will also be relevant to this topic.

Exploring all these different processes could lead to significant findings that could lead to further research, which could potentially improve current beans cultivation practices, and other plant species in a more sustainable and productive way.

The keywords that I would use to describe my research project are intra-specific competition, sustainable development, and nitrogen fixation.


Reudink, Post 2: Sources of Scientific Information

User:  | Open Learning Faculty Member: 


Source of Scientific Information:

Lu, P., Parker, W. H., Cherry, M., Colombo, S., Parker, W. C., Man, R., & Roubal, N. (2014). Survival and growth patterns of white spruce (picea glauca [Moench] Voss) rangewide provenances and their implications for climate change adaptation. Ecology and Evolution, 4(12), 2360-2374. https://doi.org/10.1002/ece3.1100

Quality of Information:

Academic, peer-reviewed research material.

Rationale:

  • This paper is “academic material” because it is written by several ecology experts, includes in-text citations, and has a references list.


  • This paper is “peer-reviewed’ because it explicitly said that was reviewed in the Acknowledgements section and because it can currently be found on PMC, which only uploads publications from journals after they have been peer reviewed (Disclaim, 2020).


  • This paper is considered “research material” because the authors conducted field research and a statistical analysis that is reflected in their Methods and Results sections


Reference:

Disclaimer. (2020). National Center for Biotechnology Information. https://www.ncbi.nlm.nih.gov/pmc/about/disclaimer/

Reudink, Post 1: Observations

User:  | Open Learning Faculty Member: 


On site: 1600hrs on March 10th, 2021.

Location: Clandeboye road, Manitoba.

Weather/Conditions: -1°c with moderate sunshine, clear skies, and snow on the ground that is actively melting

The chosen study area is the acreage that I live on off of Clandeboye road in the R.M. of St. Andrews, MB. The area is just under 39 square kilometres, as per Google Earth (Figure 1); however, I may restrict the study location to the denser forested areas (Figure 2) depending on the hypothesis I test. The area has a farm yard (no livestock) that still houses two human families and resides in the middle of flat prairies surrounded by agricultural activity in all directions. On the west side of the forested area is a small dike that varies in water volume throughout the year.

Observations:

While walking through forested area, the most abundant coniferous tree species identified was White Spruce (Picea glauca) and the most abundant deciduous tree identified was White Poplar (Populus alba). While walking along the west perimeter of the forested area, I noticed that most of the trees on the periphery were White Poplar (Figure 3). I wonder if this is a more or less desirable location to be in this habitat and if this speaks to the White Poplars’ competitiveness. I wonder if the adjacent dyke has anything to do with this observation.

There appears to be abundant biological activity within the forested area and its perimeter. I encountered an eastern grey squirrel (Sciurus carolinensis), a black-capped chickadee (Poecile atricapillus), a flock of Canadian geese (Branta canadensis). There was also signs of other herbivorous animals, surmised by the different scat dropping I observed. Track marks were present that looked to be from white-tailed deer (Odocoileus virginianus). I found a smaller White Spruce tree with a two-inch diameter oval-shaped hole in its stem (Figure 4) that had a tunnel system that was a two feet long vertically. I wonder what animal did this. They were not currently present. The tree adjacent to to it had several patches of bark ripped off of it as well (Figure 5). Perhaps the bark was taken into the hole to be ripped up and used for insolation. Perhaps the bark ripping is unrelated to the tree hole. Lastly, there are signs of moss and fungal growth at the base of some of the trees (Figure 6). I wonder what kind of ecological implications the moss and fungi facilitates.

Post1_Observations_Figures

Questions:

  1. Are the incidences of White Poplar greater near sources of water?
  2. Which animals are responsible for the hole I found in the White Spruce tree? How old is this hole? Will this hole be re-used by the original inhabitants or will it be taken over by others?
  3. Which type of tree (White Poplar vs. White Spruce) in this area supports more wildlife? What type of wildlife does it support?


Blog Post 7: Theoretical Perspectives

User:  | Open Learning Faculty Member: 


For my research project, I’m studying how soil moisture affects the distribution of western redcedar trees (Thuja plicata). This touches on how abiotic factors, such as soil moisture, can affect organisms. Water is a fundamental resource required for life, so it follows that it would play a significant role in the ecosystem. If water is scarce, the more tolerant organisms will be better competitors and have a better chance at survival.

I have found that Douglas-fir trees (Pseudotsuga menziesii) are the most common tree in both sites with cedars and without. Douglas-firs require more well-drained soil compared to western redcedar, indicating that Douglas-firs are likely to be more tolerant of water scarcity. Therefore, Douglas-firs can be found in the sites with less soil moisture, where western redcedars can not survive.

The keywords that I would use to describe this project are soil moisture, tolerance, and western redcedar.

Blog Post 6: Data Collection

User:  | Open Learning Faculty Member: 


As previously discussed in Blog post 5, and small assignment 2, I collected data to help me understand the factors that influence the growth of bean plants specifically as observed at Duggan Community Garden. The hypothesis of my research is to determine whether the presence of other plants growing near an individual bean plant influences its growth and abundance; and therefore, due to greater plant diversity in garden plots reducing intra-specific competitions which would result in larger bean plants.

In this module, I completed all my data collection. I gathered data was from two different locations, which represents two different garden beds. Each garden bed area was about 5.56m2, 3.81 length, and 1.50m width. For both locations, I did 10 sample replicates. Each of the 10 sample units was 30cm away from the others to allow for independence of every single one of them.

One of the problems I faced, was that I was unable to collect data from the third location, as I had initially planned to do so. This was because of the inaccessible fence around this garden bed, I could not reach individual beans without making damage. Therefore, I decided to avoid any damage, and thus just collected data from only two locations.

The patterns observed have made me reflect on my hypothesis. I would not say that there is significance between the abundance of bean plants and the number of other types of plants growing nearby, but the data show a potential correlation. Also, I think my data is not sufficient to determine the significance of this relationship. However, I believe that I will be able to come up with a more developed conclusion once I analyze my data on a more detailed and deeper level, and when I read more literature about similar research.

Blog Post 8: Tables and Graphs

User:  | Open Learning Faculty Member: 


My research project is examining the expansion of a stand of Trembling Aspen Populus tremuloides into a field at Campbell Valley Park in southwestern BC. I chose to use the point quarter method to determine the density of 2 size categories of aspen trees along a transect, so I had a lot of measurements documented as part of my field data.  I took all of the measurements and followed the point quarter method directions from an article (Mitchell, 2007) I found describing how to sample as well as analyse the data. For the graph that I submitted I calculated the average distance to each of the sampling points along the transect and then squared that number and the inverse of that number equaled the trees per m2. I decided to graph these values as I thought they would show the density of the different size Aspen trees from the field, into the forest. When I originally started my project, the trees had full leaves and the forest was lush and full and the soil was drier compared to the winter with wet soil and no foliage. Reviewing my original hypothesis, the data I collected does not appear so far to support that the Aspen stand is expanding into the field as there were smaller trees dispersed along the transect. I did notice that the soil was absolutely saturated in some sections and I want to explore if the data show anything when compared to that.

References:

Mitchell, K. (2007). Quantitative Analysis by the Point-Centered Quarter Method (pp. 1–34). Hobart and William Smith Colleges. http://faculty.wwu.edu/wallin/envr442/pdf_files/PCQM.pdf

Blog Post 6: Data Collection

User:  | Open Learning Faculty Member: 


For my research project, I am collecting data on soil moisture to see how it affects the distribution of Cedar trees. I am also collecting extra data on moss biomass. To do this, I am using 0.5 m2 quadrats randomly placed in both sites with Cedar trees and sites that have other trees but no Cedar trees. My data collection is ongoing at this point. I have so far collected nine moss samples from sites without Cedar trees, eight moss samples from sites with Cedar trees. My goal is to collect ten samples from each site type. Moss sampling has been going on without any problems since I fixed the GPS problem discussed in blog post five.

My biggest problem implementing the soil sample portion of my project so far has been finding the time to do it. I am aware that soil moisture varies on a day to day basis, especially with the intermittent rain that comes with spring in Nanaimo, so I must collect all my samples in one go. My plan is to collect 20 soil samples (10 for each type of site) so I know I will have to block off an entire day to do this. I will spend a day this weekend to get it done.

Since my hypothesis has changed to the effects of soil moisture on Cedar tree distribution, moss biomass has become my ancillary pattern. It seems that there is more moss in areas where I predict there will be less soil moisture. This doesn’t make sense to me, as moss tends to grow best in moist areas. This may mean there are other influences here that I am missing.

Update: I have now taken all my soil samples. The only problem I ran into was that I couldn’t dig very far down, as there were too many rocks, so all of my samples are from the surface. Other than that, I successfully collected all my samples before it began to rain!

Blog Post 6: Data Collection

User:  | Open Learning Faculty Member: 


Data collection for my project is ongoing. I am observing if the abundance of snow fleas seen on the surface of the snow changes under open or shaded circumstances. My prediction was that snow flea abundance would increase under shade.

I decided to keep on with the same data collection strategy that I used during my initial data collection venture but to ramp it up with multiple observations/counts over several days. Five 0.5m2 treatment quadrats (located under a shaded structure) and five 0.5m2 control quadrats (fully exposed to the sky), randomly spaced in a section of garden, have been visited 3 times a day since March 19 with the goal to continue this systematic temporal observation process until at least March 23. That will make a total of 15 observations, five at 10:00, five at 13:00, and five at 16:00 over the course of five days, to see if a pattern of snow flea preference to open or covered sites is apparent. So spatially there are five treatment and five control replicates, with data measurements occurring 15 times.

So far, the data collection process is going well. I have created a better data collection sheet (Figure 1) and have streamlined the process of collection so that each each count goes relatively fast. Some of the measures I took to facilitate counting should snow flea numbers be too high to quantify in 0.5m2 quadrats have been seemingly unnecessary – though I continue to divide each quadrat into 10cm x 10cm subsamples and quantify snow flea density inside each.

Even though I believe that my hypothesis is worth investigating, I’m finding that my prediction is a bit off base and that snow flea abundance appears to be greater in the open. Other weather-related factors such as cloud cover, precipitation, wind intensity, and changes in snow quality as a result of the artificial shade may be contributing to observed patterns as well as my original prediction which was based on naturally occurring shade within forests. Snow flea abundance has not been as great during this time as I had hoped, and I plan to keep the study site set up even after these 5 days are over so that I can continue to observe snow flea presence and abundance under open and shaded treatments, especially if their surface numbers explode under the right environmental conditions – factors which are still a mystery to me.

Figure 1: Updated data collection sheet

Percy Herbet, Post 1: Observations

User:  | Open Learning Faculty Member: 


Location: Duck Pond at the Queen Elizabeth Park Disc Golf Course in Vancouver BC

Date and Time: March 20, 2021 11:30

Weather: Overcast, not raining, ground is quite wet because of the overnight rain, around 10 degrees Celsius

For my project I have selected the duck pond at the disc golf course in Queen Elizabeth park in the heart of Vancouver. Queen Elizabeth is a large city park in the middle of residential Vancouver. The disc golf course is located at the Eastern edge of the park. The final hole of the disc golf course includes a tee shot over one half of the duck pond. The pond and its immediate surrounding area take up a space of around 50 meters by 50 meters. One side of the pond receives high human traffic as there is a walking path that lines the side of the pond for disc golfers to walk from the tee to the basket target. It is also not uncommon for people to wade into the pond on that same side when their discs land in the water. The other side of the pond does not receive the same level of human traffic. scrubby bushes and small trees line this side of the pond. The land surrounding the pond is very flat and covered in moss and grass. A few water lilies and other water plants can be seen surrounding the edge of the pond away from the areas of high human traffic.

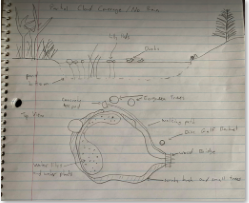
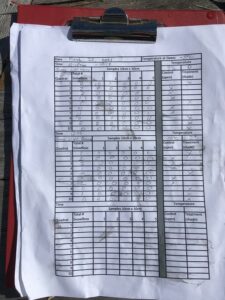
Figure 1. Field Notes. Top of page is a side view of the topography of the pond while the bottom half is a top down view of the pond and the surrounding vegetation.

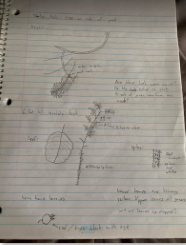
Figure 2. Field notes on vegetation. Rose hip plants appear to be a good study subject.

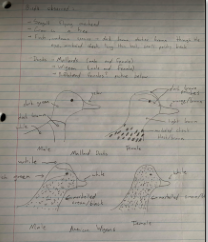
Figure 3. Field notes on observed birds.

The most notable vegetation includes the scrubby bushes and small deciduous trees lining the pond as well as three large evergreen trees, short moss and grass surrounding the pond area, and water plants in the pond. There were no noticeable signs of mammals in the area but plenty of birds could be seen including seagulls flying overhead, a crow in an evergreen tree, a small finch in the bushes, and mallard ducks, American wigeons, and Bufflehead ducks in the pond. There was also goose feces in the grass surrounding the pond.

The most likely subject targets were the wild roses growing around the edge of the pond. There are many vertical rose plants consisting of one tall shoot with no branching. These plants ranged from under 50 centimeters to well over 2 meters in height. These plants have many buds forming on the upper portions of the shoots. These buds are likely vegetative buds which will form into leaves or branched shoots. Despite the difference in size, the taller rose plants appeared to have a similar number of buds as the shorter plants. The buds on the taller plants were only located on the upper portion of the shoots leaving the bottom portions bare. The linear nature of these plants make them a good candidate for easily collecting fully objective data.

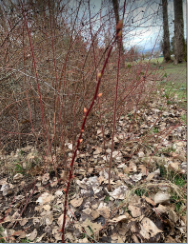
Figure 4. Close up on wild rose plant buds.

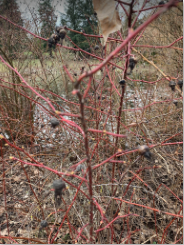
Figure 5. Dead rose hips from the previous year still attached to the plant.

Based off of my initial observations the three study ideas that I have come up with are:

  1. What impact does the level of human traffic have on the species and density of grass and moss?
  2. What impact does water plant density have on the water fowl distribution on the pond?
  3. Is there a correlation between height of wild rose plants and the number of buds forming? Is there an optimal distance range from the tip of the shoot for the buds to form regardless of plant height?

Blog Post 4: Sampling Strategies

User:  | Open Learning Faculty Member: 


In the virtual forest tutorial, the fastest estimated sampling time was using systematic sampling at 12.6 hours. Haphazard sampling was a close second with 12.61 hours, a negligible difference. Random sampling was estimated to take about 45 minutes longer at 13.4 hours. All area based samples were used.

Haphazard sampling was more accurate for common species, with the lowest percent error (eastern hemlock at 2.8% vs. 18% and 17%) (red maple at 5% vs. 14% and 33%). Random sampling was more accurate for rare species, with the lowest percent error (striped maple at 8.5 % vs. 60% and 90%) (white pine at 4.8% vs. 100% and 100%). Systematic and haphazard completely missed white pine counts.

The overall accuracy trend appears to change with species abundance as seen in the graph below (figure 1), with more abundant species showing less error when sampling density. Random sampling was the most accurate with the lowest average percent error of 12.3% versus systematic and haphazard being both greater than 40%. Random sampling seems to be much more precise over the entire range of density’s, maintaining accuracy at lower density values although requiring a longer sampling time (Table 1).

Figure 1. Actual density vs. percent error of sampling methods.

Table 1. Actual density and sampling method data for tree species in the virtual sampling tutorial.