Recent Posts

Sampling Strategies

User:  | Open Learning Faculty Member: 


The sampling strategies put a lot into perspective for me. The first strategy of symptomatic sampling was the fastest and seemed to be more accurate than the other sampling strategies, while randomly sampling and subjective sampling took longer and seemed less accurate. Overall, my data suggested it would take 12 hours to gather all this data, which was surprising in general.

Moving onto percentage errors for the two most common species and rarest species was also interesting. Eastern Hemlock and Sweet Birch, the most common species, both had low percentage errors varying from 6% to 15%. When comparing to the Striped Maple and White Pine, both species had percentage errors exceeding 100%. The most accurate sampling strategy for the rare trees and common trees seemed to be random sampling. But overall, for all sampling strategies, the systematic sampling yielded the most accurate results.

I observed that with less species, there was a larger margin for error in sampling, than for the common species. In general, I found I was curious why there are less of Striped Maple and White Pine than the other species of trees.

Overall, a very interesting tutorial!
Blog Post 9: Field Research Reflections

User:  | Open Learning Faculty Member: 


I was happy to do this research study because reading about peatlands and being out in the field built on the interest and appreciation that I already had for them.  I think that this is something I will continue to read up on.  I had a hard time landing on a design and hypothesis but when I finalized my idea it was fun to execute.

If I were to do this study topic again I would want to do it in the spring or summer.  It was very hard to identify plants in the winter and took much longer than I think it would have if there were flowers present.

Engaging in this study has altered my view of ecological theory development.  I think my final study was void of biases but I definitely struggled to design a study that didn’t feed into my preconceived notions.  I think developing theories in ecology is interesting because of how complicated the real world application is.  There are so many things to account for that could influence what you are observing.  I learned about so many more ecological interactions in my study than I noticed in my original observations.

Blog Post 8: Tables and Graphs

User:  | Open Learning Faculty Member: 


I had a hard time organizing and summarizing my data.  I thought that it would be easier to place the information in a table than it was.  After looking at it a little more I think that I will try to find a different way to organize it that is easier for the reader.  I realized after sending the assignment that the way I organized it (by transect and quadrant) did not rely the information that I wanted it to.

I changed the table by creating three tables to show the mean pH and plant diversity of each transect distance.  I also made sure to write down every species that was present.  This new format made it easier to see which species were only present at certain distances as well as which distances were more acidic and diverse.

The outcome of the data surprised me.  There were several species only present beside the walking path and several that were only present 10-m into the bog.  I also expected to see more Sphagnum moss but it was only present in 11/30 quadrants; I wonder if that is because there was disturbance near the path.

Blog Post 7: Theoretical Perspectives

User:  | Open Learning Faculty Member: 


The study I am doing seeks to investigate the effect of soil pH on plant diversity in peatlands but it also investigates the connection between soil pH and plant diversity of peatlands to land-use changes.  Some of the processes that could be at play in this study are water-logging and soil composition.  It could be that the plants that are growing closer to the pathway are not able to grow further into the peatland due to water-logging or soil composition.  It might be that the soil that was brought in to build the pathway created a better environment for these specific plants or perhaps the soil that was brought in even carried some viable seeds with it. 

The keywords that I would use to summarize my research would be peatland land-use changes, plant diversity and soil pH.

Post 9: Field Research Reflections

User:  | Open Learning Faculty Member: 


It has been a whirlwind of effort to design and implement a field experiment in a few weeks. One of the main issues that arose during implementation was that there were far more fern fronds per plant than I expected. To manage this issue, I limited the number of fronds I measured to ten per fern as that is what I could fit into my notebook, and that would hopefully have the power of statistical analysis. As I wanted to maintain consistency across all the treatments and samples, I decided that I would start with the frond closest to me at the top of the fern and move in a clockwise direction until I came back to the first fern at which point I would move to the next level down. I had also intended to look at whether the fern had fern neighbors as a way to look at density, but these results did not show any significant patterns. I think the better alternative would be to put down quadrats to determine the number of ferns in the area. Additionally, my lack of botanical knowledge was certainly a detriment to my experiment as I could not determine diversity or species richness around the ferns or even among the ferns. If I had the knowledge, I would have examined the other species around the ferns to get a better idea of the competition. Lastly, if I had the tools, I would also have measured the soil for moisture and Nitrogen content in each of the locations.

This field experiment has altered my appreciation for how ecological theory is developed. I appreciate how much effort and time goes into all the studies which help build ecological theory.

Post 8: Tables and Graphs

User:  | Open Learning Faculty Member: 


The graph was relatively painless to create as I had set up the data with clear predictor and response variables and had produced a graph predicting the results when I was developing the methods and determining the hypothesis. The most difficult part of creating the graph was coming up with a descriptive title for the graph and labels for the variables.

The outcome of the graph was as predicted and supported my hypothesis. In general, the data did not reveal anything unexpected with the exception of an insignificant result from four data points where the fern frond was eaten by something. When I was averaging my data, I removed these data points as they added factors that were outside the experimental design. It is interesting, however, that the eaten fronds were only found in the partial shade and shaded conditions, which leads me to think that maybe the organism that ate them only lives in shaded forest areas. To investigate further I would need to look at more fern samples and see there were more ferns eaten as well as look for the organisms that eat ferns.

Blog Post 1: Field Observations

User:  | Open Learning Faculty Member: 


Location: East Newton walking trail

Time and Date: March 10th 2021 14:00

Seasonality and Weather: late winter/early spring 10 degrees. Sunny with relatively clear skies

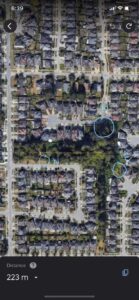
Figure. 1 satellite view of selected observation area showing the northern, eastern, and western entrances. Elevation increases from east to west

The area I have selected to observe is a small, forested area that is slightly elevated and about 223 meters long.

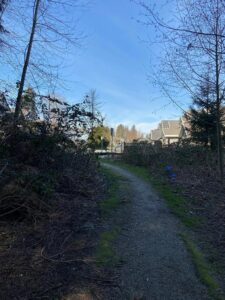
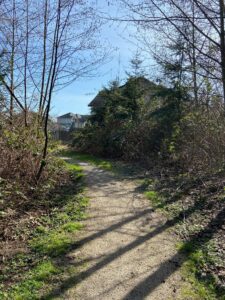
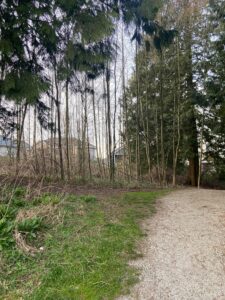
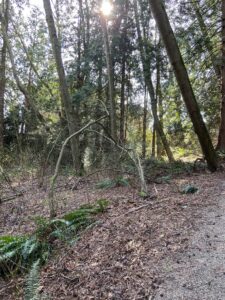
The area is fenced off from residential housing, and the perimeter is mostly surrounded by dried shrubbery and immature trees. There are three entrances to the trail, each having distinctly different vegetation. The northern entrance is bordered by winter killed blackberry bushes, while the eastern entrance is bordered by shrubs consisting of lobed shaped leaves, vines, and few blackberry bushes. The western entrance is surrounded mostly by slender leafless trees with few deciduous trees. The center of the trail is heavily covered by deciduous trees, a lot of which have curved trunks and branches. Moss, lichen, and ferns are found growing in the middle of the trail, and more appear as elevation increases. Moss and lichen seem more prominent growing on the trees found at center of the trail rather than outward. Ferns are found sporadically around the area, although more are found growing in clusters around shaded areas.

Figure 2. Northern entrance of walking trail.

figure 2. Eastern entrance to trail.

Figure 3. Western entrance to trail.

Figure 4. South West of trail showing the irregularity at which trees grow upright and the sporadic growth of ferns.

Based off my observations, the questions I have come up with are as follows:

  1. How do man-made borders affect the density of tree growth in the area and what kind of factors favor a higher density?
  2. How does accessibility/inaccessibility to sunlight affect the sporadic growth of ferns in this area?
  3. How does slope instability affect the curved shape trunks of trees?


Blog Post 3: Ongoing Field Observations

User:  | Open Learning Faculty Member: 


My study will be examining the density of coniferous trees in proximity to an adjacent creek (specifically Pinus ponderosa). The environmental gradient was chosen from the riparian bank to the upland forest apex, with three locations observed along the gradient; the riparian area, flood plain, and upland forest.

Observations were recorded in the field notes below, and in essence describe the density of tree species in relation to the area. It was observed that broad leaf deciduous trees dominate in the riparian area, with a noticeable lack of coniferous growth. The complete inverse was noted in the upland forest, with only Ponderosa pine inhabiting and a more diverse mixture of species in the adjoining flood plain.

I since formulated the hypotheses that the density of Pinus ponderosa decreases with proximity to Mission Creek within the observation area. A potential response variable would be tree concentration, while a predictor variable may be distance from riparian bank, or possibly the attributed soil conditions. These natural variables are both continuous, and would therefore justify a regression analysis.

Figure 1: Field notes (Loverin, 2021)

Blog Post 6: Data Collection

User:  | Open Learning Faculty Member: 


My research project looks at the expansion of a stand of Trembling Aspen Populus tremuloides into a field at Campbell Valley Park in southwestern BC. I chose to sample using transects along 2 randomly drawn locations along the field started from the side of the stand. With 5 sampling points along the transects and trees sampled in each “quadrant”, I took 40 replicate samples. The sampling was fairly straight forward, but I did not expect to be caught up in so may dried blackberry bushes!

I originally chose this location last year when the leaves were on the trees and the forest was dense. I have now gone back to do my sampling and the forest and trees look much different in the winter. The soil was dry then and now it was very moist and even saturated in some sampling points. Since the forest was also bare, I could see different patterns that were not as clear in the winter. While I still think the Aspen are growing into the field, since this is the only location where the stand can expand (the back is paved and there is a trail to one side), there may be more environmental drivers behind this. I will now have to look at my data and see if my hypothesis of a higher density of younger trees near the forest edge is shown.

Blog Post 6: Data Collection

User:  | Open Learning Faculty Member: 


For my data collection I used transects as a sample unit and 1×1 foot quadrants as my subunit.  I had 10 replicates of each sample.  Each transect was 10 meters apart and each began at the edge of the foot path, followed the gradient down the mound of the hilling and ended in the peatland.  The transect was interrupted at 5 m intervals.

I did struggle implementing my design a little because it was harder than I expected to walk that far off the pathway and into the peatland area.  I also ran into a little more soil water-logging than I had expected but that may be due to the time of year I took these samples.  I used an EXTECH pH Module to take the pH from the centre of each quadrant.  It was a little difficult walking through the peatland with all my supplies and taking the pH sample from the centre of each quadrant.  Some of the quadrants had large plants in the middle that I had to work around to reach the soil below. 

I will be reflecting on the water moisture, pH, and soil composition.  I also might think that there is something to be said for how hard it was to walk in there and so how less disturbed it must be by humans overall.