Recent Posts

Blog Post 5: Design Reflections

User:  | Open Learning Faculty Member: 


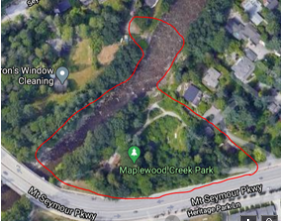
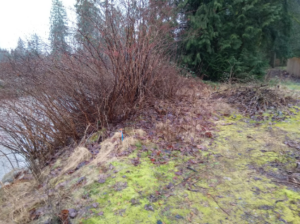
I have changed my study topic and will not be carrying out the study that I outlined in earlier blog posts.  My new study will also take place at the Richmond Garden City Lands.  During the implementation of my previous study I noticed that there was a man made walkway through the bog and that there appeared to be more abundance nearer the path.  I have decided to collect samples on a transect. I used five transect lines spaced 5-m apart.  Each transect began on the edge of the man made path and was walked 10-m East into the bog.  The transect was sampled at three random points (1-10 meters from the path).  At each point I placed a quadrant and identified the amount of vegetation covered using a 0.5-mx0.5m quadrant that was gridded to have 25 10-cmx10-cm squares.  I took the pH of from the centre of each quadrant to see if there was an association with pH and vegetation abundance as well.  


I thought that it would be a good idea to do the transect sampling randomly.  By laying out 5 transects and randomizing a number from 1-10 using the generator from random.org.  I have changed my mind on this and will be sampling systematically at three points spaced 5-m apart on each transect.  I decided to change this strategy to make sure that quadrants were not too close to each other so that I could be confident that these samples had independence.   


Collecting this data also made me realize that I lacked focus for a hypothesis.  I found that plant diversity had a more interesting pattern.  There was more plant diversity near the path than there was in the bog.  I think that this is because many plants are sensitive to slight changes in pH and the man-made path brought less acidic soil to the bog.  I think that this is why there is less species diversity further away from the path.  I believe that plant diversity will decrease as the soil becomes more acidic.  The transects will be used in the same design as described above but the predictor variable will be soil pH (or acidity) and the response variable will be plant diversity.

Blog Post 3: Ongoing Field Observations

User:  | Open Learning Faculty Member: 


The organism that I plan to study is the fern. I wonder what conditions ferns thrive, whether they grow better in sunny areas, semi-shaded areas, or shaded areas. The idea would be to look at the length of fern leaves and compare them across the different gradients.

I live on one side of a ridge and on my side where my house is, there is a large sunny yard, at the top it is semi-shaded, and on the other side it is completely shaded by old growth trees. The three locations along the gradient are the one area in my yard, which is near the top of the hill, and then following along the transect moving to a semi-shaded area at the top of the hill, and then moving along the transect down the other side of the ridge which is heavily treed. In the sunny area and in the shaded area there appear to be a lot of ferns, which are densely packed. Similarly, in the woods where there is no sunlight, there are similarly a lot of ferns. In the semi-sunlit areas there are also ferns, but not as densely packed. Having attempted to remove ferns from the yard, I observe that they are relatively tough. 

I hypothesize that the amount of sunlight positively impacts the growth of the ferns. I predict that the ferns will grow bigger in the sunlight areas because they thrive off more light. 

One potential response variable is the length of fern leaves and the explanatory variable is the amount of sunlight. The response variable is continuous and the explanatory variable is categorical meaning that it would be an ANOVA design. 

Post 2: Sources of Scientific Information

User:  | Open Learning Faculty Member: 


a)The source I’ve chosen is “The resilience and functional role of moss in boreal and arctic ecosystems”. It is a academic, peer-reviewed, review manuscript, combining and modelling non-original research to show growth responses of mosses related to nutrients, heat, water, and especially disturbances in northern climates. This article was chosen since currently we are in winter in a northern climate. Although it especially focuses on boreal forests in Alaska, there are similarities that I thought would bring insight into my Field Research Project surround mosses and their place in an ecosystem. (https://nph.onlinelibrary.wiley.com/doi/10.1111/j.1469-8137.2012.04254.x)

b) The article is peer-reviewed because it was reviewed by Courtney Miller, and advice and discussions with Jill Johnstone, Dale Vitt, Werner Kurz, David Olefeldt, Teresa Hollingsworth, and comments from two anonymous reviewers.
The article is academic as it is lead by Merritt R. Turetsky, who is a part of the Department of Integrative Biology, University of Guelph, Guelph ON N1G 1G2, Canada.
The article is a review article since the research shown is not originally done by the author, and the modelling done by the authors is the combination of other researcher’s findings.

Post 1: Observations

User:  | Open Learning Faculty Member: 


Date: Feb 28, 2021 (Winter)
Time: 1400
Location: Seymour River/Maplewood Creek Park
Topography: northern cliff is approximately 60 degree slope down to the river, artificially-placed rocks along slope and river bank. Southern slope (park-side) is around 45 degrees with similar rocks like the northern slope.
Weather conditions: Cloudy, slight breeze, approximately 5 degrees Celsius.
Vegetation: forested with native and ornamental trees/shrubs, different species of moss along river bank and upper slope.

Questions:
1. What different types of mosses exist on both sides of the river, where do they grow, and what populations do they support?
2. There is a large growth of invasive Japanese Knotweed on the northern, upper slope of the riverbank. What is currently being done about the species and how has the plant/treatment affected the local ecosystem?
3. What kinds of animals use the park, and what factors attract them to the park?

Blog Post 6: Data Collection

User:  | Open Learning Faculty Member: 


Location: Kenna Cartwright Park             Date: Jan 23, 2021                   Time 2:30 pm

10 random numbers between 0 and 1000 were generated on an online random number generator. These figures were used as the distance from the entrance point. 

At the park, the distances were measured using a distance measuring phone app (Runkeeper). 

At each of the 10 distances, the Ponderosa pine trees in a 5m radius from the point were considered. Only the trees on the upward slope (towards the top of the hill) were considered.  

For the pine trees in the radius, the following were recorded: the distance from the entrance point, the elevation and the diameter of the trunk at breast height (DBH) (1.4m). This was repeated for all 10 replicates. 

There were no significant problems faced when collecting the measurements for the trees. 

An ancillary pattern observed was the increase in DBH with increasing elevation, which increases with the distance from the entry point. 

Post 4: Sampling Strategies

User:  | Open Learning Faculty Member: 


Sampling Strategies

The sampling techniques used in the virtual forest tutorial were the systematic sampling, the random sampling, and haphazard sampling. The technique that had the fastest estimated sample time was the systematic sampling along a topographic gradient at 12 hours and 36 minutes. The random sampling took just a little bit longer at 21 hours and 43 minutes, and the haphazard sampling took the longest at 13 hours and 4 minutes. It is unsurprising that the systematic sampling took the least amount of time as the experimenter would be moving along as transect instead of wandering randomly around.

The percent error of the different strategies for the two most common species, Eastern Hemlock and Sweet Birch, and two least common species, the Striped Maple and White Pine, were as follows. The percent error for the Eastern Hemlock was 12.2% for the systematic sampling, 8.2% for the random sampling, and 10.7% for the haphazard sampling. The percent error for the Sweet Birch was 38.7% for the systematic sampling, 29.1% for the random sampling, and 32.8% for the haphazard sampling. The percent error for the Striped Maple was 8.6% for the systematic sampling, 4.6% for the random sampling, and 54.3% for the haphazard sampling. The percent error for the White Pine was 100% for the systematic sampling, 48.8% for the random sampling, and 100% for the haphazard sampling. 

Table 1. Sampling Error (%) for the two most common and two least common species.

Sampling type Eastern Hemlock Sweet Birch Striped Maple White Pine
Systematic Sampling 12.2% 38.7% 8.6% 100%
Random Sampling 8.2% 29.1% 4.6% 48.8%
Haphazard sampling 10.7% 32.8% 54.3% 100%

The accuracy decreased drastically in situations where there were limited species, such as with the White Pine where systematic and haphazard samples had errors of 100%. This was not the case, however, for the Striped Maple where the percent error was very low for the systematic and random sampling, although it was high for the haphazard sampling. The accuracy likely increases with greater abundance as there are more samples and so a greater difference between estimated and actual is needed in contrast to limited samples where the existence or absence of a few samples can change the sampling error.

Overall the four species in Table 1, it appears that random sampling was more accurate than systematic sampling and haphazard sampling. Haphazard sampling was more accurate than systematic sampling where there was a greater population, but had a greater percent error for the Striped Maple and the sample percent error for the White Pine. 

Blog Post 4: Virtual Forest Tutorial

User:  | Open Learning Faculty Member: 


I used the distance-based methods in the virtual forest tutorial.  Systematic sampling was the fastest, taking 4 hours and 15 minutes, random sampling took 4 hours and 38 minutes and haphazard was the slowest at 4 hours and 44 minutes. 

Random sampling had the most accuracy in regards to the two most common tree species and one of the rarer species.  Systematic sampling was the most accurate in regards to the rarest species (white pine).  The haphazard sampling method was not accurate in regards to both abundant and scarce species. 

The systematic sampling technique was more accurate with scarce species than common species and this could be due to the nature of distant-based sampling along one direction.  The systematic sampling method may have not been the most accurate in every species sampled but it did have the most accurate average overall and seems to be a more reliable method of sampling.


Sampling Technique % Error Eastern Hemlock (common) % Error Sweet Birch (common) % White Pine (rare) % Striped Maple (rare)
Systematic 9.9% 64.0% 1.2% 3.4%
Random 3.1% 47.4% 100.0% 0.5%
Haphazard 138.0% 142.9% 142.0% 16.5%

Blog Post 5 – Design Reflections

User:  | Open Learning Faculty Member: 


During the first sampling collection, I used quadrats to sample Aspen trees wanting to determine if younger trees (saplings) were growing towards the field due to the availability of light. My sampling method had some issues that I will resolve by modifying my approach. I found that the Aspen stand was a lot smaller than I had originally determined and that almost 6 of the quadrants did not have any Aspen in them which would have skewed the data. Furthermore I was only sampling one tree per quadrant and this would not have produced enough data.

Moving forward I will be using a random sampling method using transects from the field into the forest. I will start with steps from the southwest corner of the field and sample at 1m, 9m, 17m, 25m and 33m distance from the field. I will also split my sampling into mature (breast height circumference over 10 cm) and young  ( breast height circumference under 10cm) and new shoots (under 2cm). This will ensure that I can determine the the average number of trees per square meter in each part of the forest sampled for both young and mature trees.

Blog Post 6: Data Collection

User:  | Open Learning Faculty Member: 


First day of sampling occurred on Saturday, Feb 27th at approximately 9:30am within the headland island of Pipers Lagoon, in Nanaimo B.C. 

Study Hypothesis: Broadleaf Stonecrop abundance is determined by substrate drainability.

For my first day, I sampled three replicates on the Western portion, and one replicate on the Northern portion of the headland island. Each replicate consisted of a 40m long transect with the starting point randomly placed above the high water mark along the backshore. I originally planned to do a 50m length but felt it was redundant to sample that far into the inland forest. I chose the heading of each transect to be approximately towards the center of the headland island. Each transect, therefore, covered the full environmental gradient from coast to inland forest.

Along each transect, I placed a 1m2 quadrat starting at 0m and then every 3m, for a total of 14 subsamples per transect. Within each quadrat, I recorded the elevation above sea level, the substrate type, the sloping characteristic (gradient), the percent cover of my study subject (Broadleaf Stonecrop), and the distance along the transect. I also made note of the amount of sun exposure specifically whether it was an open space, or shaded by other vegetation.

Overall my study design was effective, albeit somewhat time-consuming. To speed things up a bit I may take pictures of each quadrat and from those assess the percent abundance and substrate type. I did have to adjust the starting locations of a couple transects slightly to allow for safer access to points along the transect.

Generally, my data collected thus far does tend to agree with my hypothesis, although based on patterns observed, sun exposure does seem to also play an important role in the Broadleaf Stonecrop abundance.

I will continue to implement this study design throughout the remaining area of the headland island. This will require 2 more transects in the Northern portion and 3 each in the Eastern and Southern portions for a total of 12 transects (replicates).

Post 9: Field Research Reflections

User:  | Open Learning Faculty Member: 


Overall, I enjoyed this experiment and spending the amoutn of time observing that I did. I enjoyed getting out early each morning before work and observing the birds at the local natural park. There were far more species than I had seen there previously. There were times that I found it quite cold, of course. At times, being outside for an hour at 7am, in January, was really quite cold. But observing the patterns and species present, was really quite interesting. In hindsight, I think I would have implemented a different/better design or hypothesis. The location I had available to me was perfect for observations, but I could likely have chosen a better route for my study. The practice of ecology is more complex and involved than I had considered or realized previously, and I certainly have a higher appreciation for it having completed the course.