Recent Posts

Post 5: Design Reflections

User:  | Open Learning Faculty Member: 


Previous data collection method

I used random.org for all my random number-generation. In my methods descriptions below, I will put the parameters for the generated number in brackets.

For my recent field observations, I decided to use simple random selection to choose sampling sites. I chose my starting point by walking 20 paces (10-30) north of the steps up to Volunteer Park. My process for determining the actual sample sites required me to be able to move in any direction, so it was important to have a starting point that was not on the edge of the beach.

Each new sampling site was chosen in a two-step process. I generated a number to indicate direction (1-4, where 1 = northwest, 2 = northeast, 3 = southwest, 4 = southeast), then generated a number of paces (5-15) to walk in that direction to take another sample. I repeated this procedure 10 times, more than the required 5, because the first five samples had no oysters at all (an early sign that the method would have to be modified).

At each sampling site, I recorded whether or not there was a large rock present (as a yes or no), and how many oysters I saw within the quadrat (oyster numbers broken down into two categories, attached and unattached).

Difficulties in implementing that sampling strategy

With my previous sampling strategy, each sampling site basically fell into one of four possible categories:

Notebook Scan on Feb 23, 2021 at 19_32_24


Almost all of my sampling sites were in the bottom right quadrant – they had neither rocks nor oysters. If I was seeking to measure the density of the oysters on the beach, those would be useful data points, but I am primarily interested in whether oysters are more likely to be near large rocks. Upon reflection, even the bottom left quadrant – rocks but no oysters – is not relevant either, because my question isn’t “are rocks more likely to have oysters nearby?” (which is superficially similar to “are oysters more likely to be near rocks?”).

I also was not leaving markers of where I had previously sampled, and my randomization method did not account for or prevent me from going back over previous areas. Since I was equally likely to go south or north, east or west, on average I was generally staying in the same place.

I diagrammed my movement using my notes, and it’s clear that some sampling sites were very close together. With more options for directions, eg. including north, south, east and west (so 1-8), I probably would have been less likely to ever immediately backtrack, but still equally likely to circle back to the same places. Although my previous strategy was random, I don’t think the sites were all sufficiently far apart to be independent.

Modifications to sampling strategy

Going forward, I will change how I randomize (for better independence) and what specific information I collect (to better address the research question).

Randomization

I will first measure out a section of the intertidal zone in paces, and then diagram it in my field journal. From there I can generate a set of x- and y-coordinates using random.org with the parameters I just measured. I’ll place those coordinates on my diagram in order, and eliminate any that are within a certain number of paces of a site that’s already on the map. I’ve drawn up an example of how this might look.

Data collection

At each sampling site, I will look for the nearest oyster. I will then record whether it is close to a large rock, or not. I believe this will better address the research question, because each oyster will be the sampling unit and the recorded information will then allow me to compare the number of oysters near rocks versus the numbers not near large rocks. To note any potentially confounding variables, I will also record whether that oyster is attached or not (in case attached oysters are more likely to be on rocks than unattached), and measure the oyster’s size.

Surprises in data collected so far

In the data I have already collected, using the previous sampling method, only four samples even had oysters present. Contrary to my expectations, half of the sampling sites that contained oysters did not have any large rocks. The most oysters found at one site (6) were found in a clear space without rocks.

I am not going to draw any conclusions from that information because, as discussed above, the method for collecting the data was flawed, and I don’t think four data points are sufficient.

Post #9 Field Research Reflections

User:  | Open Learning Faculty Member: 


I ultimately really enjoyed this course and the project. I have spent time in conventional as well as online post secondary and while both have their pros and cons, I really miss having the hands on learning experiences and doing things other than reading from a textbook and filling out assignments. It really made all the difference in terms of how I thought about concepts and made connections because having to be out in nature looking for patterns and really observing translated the information into a mode I could easily remember. I also really enjoy academic literature and the number of studies we had to read for this course really gave me an appreciation for coherent academic literature and I really drew on methods I liked to write my own report.

As for the project itself, I learned a lot about what goes into conducting these studies. Most of the data collection and observations were tedious, cold, and the worst of all: involving math. Furthermore, it was very discouraging to get a nonsignificant result and to later learn about multiple reasons why my experiment failed. On the other hand, it was very good for my ego to have failed and I learned a lot more from what went wrong than I think I would have had the experiment rejected the null hypothesis. To add to that, I also really felt proud at the end of my report having written pages and pages of a study I conducted, commenting on data I collected, picking apart methods that I had created and communicating ideas and concepts I had read about and learned. I now know how more to assign variables and evaluate their validity and the importance of doing the abundance of research before you plan the study rather than after.

I already had a deep appreciation and respect for the natural sciences and ecological theory, but this course really gave me a renewed respect for nature and the incredible amounts of intelligence the natural world holds. I think there is a lot to be learned from it that modern day humans don’t always recognize and through learning all of this information, I felt a little put in my place in terms of my role on the planet as a whole. In addition, I think this intelligence and these concepts can be applied to areas of psychology, which is my main area of study. Human minds in their own way are little ecosystems that have a natural covering of different species (genetics), are subject to disturbances (trauma) and invasive species (human influence), and have their own innate tolerance, resilience, and factors that dictate what state they are in.

Overall, I really enjoyed this course and would like to deeply thank Robyn for all of her hard work.

Post 4: Sampling Strategies

User:  | Open Learning Faculty Member: 


Of the three sampling techniques (systematic, random, and haphazard) that I used for the virtual forest tutorial, the technique with the lowest average error rate was the systematic sampling.

The fastest technique was the haphazard sampling (12 hours 34 minutes), but the difference between the fastest and the slowest was only 13 minutes (1.7% of 12 hours 34 minutes), which is fairly negligible.

Screen Shot 2021-02-21 at 22.29.22

Common vs. rare species

The average error rate for the two most common species, Eastern Hemlock and Sweet Birch, was 18.1%. The average error rate for the two least common species, Striped Maple and White Pine, was 42.9%. From this dataset, it appears that the accuracy did decrease with species rarity.

Comparing sampling techniques

Systematic sampling had the lowest average error rate, at 16.7%. Random sampling had the highest average error rate, at 46.2%.

Based on this dataset, systematic sampling appears to be the most efficient and accurate. With systematic sampling, I found the lowest error rates (on average) with only a two-minute time penalty over the fastest technique. The 16% error rate average still seems high, to me, so I would want to re-do this exercise multiple times, probably with more samples, to be able to better identify the technique most efficient in this setting and its most efficient number of samples.

Post 8: Tables and Graphs

User:  | Open Learning Faculty Member: 


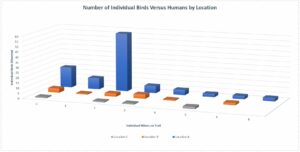
It is difficult to see the chart below, but it represents the values of individual birds documented, the number of humans/hikers that were present on that portion of the trail at that time, and it is separated by the three Locations A, B, and C which were observed. It did take some time for me to organize and rearrange my data into formats that would pull the information I was looking for. I did find it to be challenging, but also a learning experience. My data did reveal a few patterns that I was surprised by. It appears that the bird populations tend to be much more abundant at Location A regardless of human activity, which I was not expecting. The hiker traffic did not appear to have much impact on the bird behaviour. Though, this may have been because the hiker numbers always remained quite minimal .

Post 3: Ongoing field observations at the Vancouver beach

User:  | Open Learning Faculty Member: 


My second field observation took place on the 20th of February, from 15:05 to 16:30, at multiple sites in the intertidal zone along the stretch of beach north of Volunteer Park. The weather was overcast and lightly spitting (it started raining more fully right after I finished), and approximately 7 degrees. High tide had been predicted at 10:34 (4m), and low tide was predicted for 18:34 (1.6m).

I initially wanted to compare oysters & mussels along the gradient from the top of the beach towards the water’s edge, by recording the number & size of all the oysters and mussels found in three spots from the beach’s edge to the water’s edge. I quickly realized after I started to make observations that the number of mussels, their sizes (ranging from 5mm to 90mm) and their close proximity to each other and attachments to various surfaces made this initial plan impractical. I decided to focus my observations on oysters instead, but because there were fewer oysters, I thought just three observations sites along the gradient might not be sufficient.

Ultimately I chose three locations along the beach – one at the stairs from Volunteer beach, the other two approx. 40-60m to the west and east of the stairs – and, starting right at the edge of the beach, I walked in a line towards the water. With each pace, I turned around and counted the number of oysters visible in the space between myself and where I had stood at the previous pace, within about 1 metre to either side (see the rough diagram in red, in the photos of my field journal). Each count was recorded in one square in my field journal, and I paced and counted until I ran out of space on the page. As I counted, I noticed that there seemed to be more oysters where there were big rocks (greater than ~30cm) than more “clear” areas, so I noted where there seemed to be more rocks as I was counting. In the third location, counting was hampered by the presence of seaweed/algae/general mud & slime that covered lots of the rocks and surface.

I want to focus on the distribution of the oysters, comparing areas with large rocks to areas without.

Possible processes that might cause the distribution difference:

  • large rocks provide more shelter, so in areas without shelter, the oysters are more likely to be predated upon by birds and therefore fewer would be found there
  • obviously since some of the oysters are not unattached, a large rock provides more surface area for oysters to attach, so more would be found there
  • possibly confounding factor: more attached oysters by big rocks might be competing for resources with unattached oysters, so more unattached oysters might be in places without large rocks

I hypothesize that the shelter provided by large rocks will cause more oysters to stay nearby. My prediction is that I will count more oysters, attached and unattached, very close to large rocks than I will count where there are no large rocks.

The predictor variable would be the presence of a large rock, which I would not control so it would be a natural, not a manipulated experiment. It is categorical, because it is either the presence or absence of large rocks. The response variable would be the number of oysters, which is a categorical variable, because it is a count of how many there are (contrast with if it was a measure of how big they grow, which would be continuous).

Post 7: Theoretical Perspectives

User:  | Open Learning Faculty Member: 


There are several ecological processes and factors which are relevant to my hypothesis. The abundance and variety of bird species observed at each of the three locations will be affected by several influences. The ideas that unpin my research include:

  • Which indisputably granivorous birds are native to the area
  • The disturbances caused by hikers along the trail
  • The diversity and abundance of birds in relation to forest fragmentation
  • Temperature, precipitation, and other weather conditions which may affect behaviour
  • Makeup of birds present when considering migratory and sedentary species
  • Presence of predators at feeders

Keywords that I could use to describe my research project include indisputably granivorous birds, bird predators, aves, ornithology, and recreational path.

Post 6: Data Collection

User:  | Open Learning Faculty Member: 


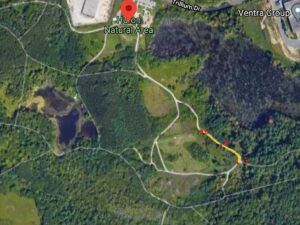
Because the natural park that I was sampling from is located almost directly next to my place of work, I was able to sample each morning for an hour before heading to work. I sampled from 7-8am each week day starting from January 11th, until February 5th. This meant that I sampled on 20 separate occasions. It was made extremely easy in that it is so close to my work place. With my markers set up for my three testing locations, I spend twenty minutes at each location observing the bird species that I see. I created a tally sheet including any species that have already been identified, with room for any new varieties. Sampling at the location itself went quite well and was relatively easy. Some mornings were quite cold, but it was interesting to observe how different weather conditions seemed to influence the presence of bird species. There were species which I was unable to identify. In those cases, I would take a few pictures of the bird and then identify at a later time. That was challenging at times, thought with the resources I have and the expertise of the staff on site at the natural park, I was able to identify all birds that were observed. The ancillary patterns which I observed did not consistently support my hypothesis. Other considerations such as temperature, precipitation, and hiker presence seemed to contribute to the presence or lack or presence of bird species variety and abundance.

Post 5: Design Reflections

User:  | Open Learning Faculty Member: 


The data that I collected in Module 3 did prove to be interesting. I was unsure how many birds and how many different species I would be able to observe in the hour and 15 minutes that I conducted the data collection. I saw four different species, three of which I was able to identify immediately, and one that I was able to later identify. I would consider this one difficulty in the study. I knew that I would of course not know all local species going into this study, but was unsure if I would be able to properly identify any that I did not already know. On this day, I was able to take a few photos of the species that I was unable to identify, which made it significantly easier in identifying at a later time with more resources.

The location where I collected the data was at Location A of my test site, which is where I anticipated finding the most variety of bird species as well as abundance. At this location there is a clearing with bird feeders. There are also park benches, and therefore tends to have more people present. On the day where I collected data, it was not only raining, but I collected data at 8am. I saw very few people, which may have affected the bird’s behaviour or presence.

I did choose to modify my approach in that in my full field research for this assignment, I observed the number of species and their abundance at three separate locations, points A, B, and C. The proximity to the bird feeders, to more human traffic, and to a clearing in the forest all the three variables which I chose to observe for this study. The sampling technique proved effective. I was not observing the location for so long that I lost patience, concentration, or interest. I think an hour of observing each day is an appropriate and sustainable amount of time to allot to the observations.

Post 4: Sampling Strategies

User:  | Open Learning Faculty Member: 


There were interesting and unexpected results determined regarding accuracy and time for each method of sampling in this assignment, which was completing the virtual survey of the Snyder-Middleswarth Natural area. The sampling technique which proved to have the fastest time was the systematic transects technique. The sampling style with the lowest percentage of error turned out to be the haphazard selection method. The accuracy of the study was affected by species abundance. The sampling accuracy decreased with a decrease in species abundance. An increase in sampling size would be effective in increasing accuracy. The percentage of error is increased when sample sizes are decreased. I was not necessarily surprised that the systematic technique was the fastest sampling method, but I was somewhat surprised that the haphazard selection method resulted in the lowest percentage of error.

Blog Post 2: Sources of Scientific Information

User:  | Open Learning Faculty Member: 


The chosen information source to evaluate was the paper “Reconnecting Amphibian Habitat through Small Pond Construction and Enhancement, South Okanagan River Valley, British Columbia, Canada.” Written by S.L. Ashpole, C.A. Bishop, and S.D. Murphy.

This source has been classified as Academic peer-reviewed research material. This is justified by meeting the conditions noted below:

Academic:

The paper is written by expert authors affiliated with institutions and government as stated in the article heading (St. Lawrence University, University of Waterloo, Environment and Climate Change Canada) (Ashpole et al., 2018). The material also uses in text citations to other literature and is complete with a bibliography on pages 13-16.

Peer-reviewed:

“Diversity” is a peer reviewed journal as stated on the publishers website (MDPI, n.d.). The paper also mentions additional referees in the “Acknowledgments” section on page 13 (Ashpole et al., 2018).

Research:

The paper reports results of a study completed by the authors, containing both methods and results sections on pages 2 and 6 respectively (Ashpole et al., 2018).

References:

Ashpole, S. L., Bishop, C. A., & Murphy, S. D. (2018). Reconnecting amphibian habitat through small pond construction and enhancement, South Okanagan River Valley, British Columbia, Canada. Diversity, 10(4), 108. https://doi.org/10.3390/d10040108

MDPI. (n.d.). Diversity. https://www.mdpi.com/journal/diversity