Recent Posts

Blog Post 1: Observations

User:  | Open Learning Faculty Member: 


On site: 17:00 hours, February 17th 2021

Location: Mission Creek Regional Park

Weather/conditions: 3°c southern winds, light dusting of recent snowfall, late winter conditions with the sun nearly set.

The chosen study area is approximately five square kilometers (paced) within Mission Creek Regional Park in Kelowna, BC. Located west of the Springfield road park entrance, and on the south side of the creek. The area spans north to south from the creek bank to the apex of the upland north-facing slope, crossing a dyke/trail and forested flood plain. The area is bordered by walking trails on the east and west sides. Historically, Mission Creek was narrowed to protect the city and the dykes are now a popular walking path.

Observations:

The creek flows east to west/southwest, and is mostly frozen on the surface after the recent cold snap. Only small pockets of flow remain visible. The creek bank is comprised of riprap leading to a shrub and small deciduous tree riparian zone, meeting with the dyke built parallel to the creek.

The area descends back to creek elevation (several meters) into a forested flood plain/depression zone to the south. This flood plain contains diverse layered vegetation, with dominant shrubs identified as Oregon Grape (Malonia aquifolium) and Common Snowberry (Symphoricarpos albus). The tree population was fascinating, with such a variety of mature growth; Ponderosa pine, Birch, Douglas Maple, Poplar, Alder were identified. A few young evergreens were spotted growing in the midst. Decaying logs and leaves of several species were noted on the forest floor. Transitioning further south into the uplands, the vegetation thins into that of a dry forest consisting of Ponderosa Pine and Grass at the slope apex.

Figure 1: Flood plain looking south towards uplands. (Loverin, 2021)

Questions:

  1.  Is the concentration of deciduous trees in the flood plain related to the creek proximity? or the natural depression of the area?
  2.  Are there fewer Ponderosa Pine closer to the creek? possibly more competition or less favorable conditions?
  3. Does the human disturbance in the area impact the growth and dispersal of the common snowberry (Symphoricarpos albus)?

Field notes – blog post 1

References:

Loverin, K. (2021). Flood plain looking south towards uplands. [photograph].

Parish R., Coupe R., Lloyd D. (1996). Plants of Southern Interior British Columbia. Lone Pine Publishing.

Post 3: Ongoing Field Observations

User:  | Open Learning Faculty Member: 


Ongoing Field Observations

What I plan to study are the variety or bird species and number of each bird species seen in three locations on this trail. I will observe species at the top of the hill on this trail. This is where the parch benches and feeders are, as well this is where there is a somewhat large clearing. I also plan to observe the species of birds present 100m from this point, as well as 200m from this point. I will observe the birds in terms of the variety of species, and how many of each species I observe within a set time. Each visit to the trail will be one hour. I will spend twenty minutes at each of these plots observing the species.

I hypothesize that the birds will be inclined to visit the feeders at the top of the trail, regardless of the larger number of people in this location. Therefore, I predict that there will be more species and a greater number of birds at the clearing at the top of the hill, than there will be at either of the other two test locations. I predict this outcome due to the bird feeders present, despite there being more people and less coverage  in this area.

A response variable within this study is the number of birds and variety of bird species that will be observed. This variable will be categorical, as it will entail the presence and/or absence of specific species. An explanatory variable would be the three locations which will be tested, and their proximity to the bird feeders, park benches, and forest clearing. This variable is continuous, as is can be measured by distance.

Post 2: Sources of Scientific Information

User:  | Open Learning Faculty Member: 


The source of ecological information I have chosen to evaluate is Birds as mediators of passive restoration during early post-fire recovery from Biological Conservation, Volume 158.

Using the course information from the tutorial on how to evaluate sources of scientific information, I would classify this article as academic, peer-reviewed research material.This article contains in-text citations as well as a list of all cited literature. This article is research material because it contains materials and methods, results, and discussion sections. It is also peer-reviewed because it specifically mentions editors, as well as the dates the article was edited and then accepted.

Article link:

Cavallero, L. Raffaele, E. Aizen, M. (2013). Birds as mediators of passive restoration during early post-fire recovery, Biological Conservation: Vol. 158: p. 342-350. Available at: https://www.sciencedirect.com/science/article/abs/pii/S0006320712004247

Post 1: Observations

User:  | Open Learning Faculty Member: 


January 8, 21
3-4pm
Sunny
-7 degrees Celsius

Initial Field Observations at Huron Natural Park – Meadow Trail

Huron Natural Park is a park located in Kitchener, Ontario. Within the Park, the Meadow Trail is the trail which I am choosing to observe. This trail is 0.6km in length. It is quite hilly, but is a relatively easy trail. Either side of the trail is forest, with a combination of deciduous and coniferous trees, though the trees are mostly deciduous along this trail. As it is winter, this means the forest is mostly bare. I chose this trail as it is one of my favourites at this park. The path itself is almost a clearing as it is quite wide. This trail is known for having a large number of bird species. At the top of the hill along this trail, there is a clearing with a bench. There are also two bird feeders located in this clearing area at the top of the hill. On my initial trip to the trail, I observed a blue jay, a brown creeper, and a red-breasted nuthatch along this trail.

The three questions which my observations made me consider were:

  • Are bird species more prevalent at the feeders? This area does have benches for people as well, so I am unsure how popular these feeders may be.
  • As partial-migrants, can I expect to see any red-tailed hawks at the clearing of this trail? They are known to occupy this area in warmer weather.
  • As the park is far less busty due to covid-19 restrictions, can I expect to find more species here than can usually be found?

Post 2: Sources of Scientific Information

User:  | Open Learning Faculty Member: 


Non-academic scientific source

Kimmerer, R. W. 2020. Braiding Sweetgrass (2nd Hardcover Edition). Milkweed Editions, Minneapolis, Minnesota, USA.

Type of scientific information: Non-academic scientific source.

Written by an expert in the field

  • Kimmerer is an ecology professor at SUNY-ESF
  • This book isn’t affiliated with her institution but the subject of the book is the same as her professional work, and the book is included on her faculty bio

Has a bibliography

  • pages 379-380 of the 2nd Hardcover Ed. 
  • Also has a note on page 378 about citations for oral history and storytelling

Does not have in-line citations

Because this book does not meet the requirements to be considered an academic source of scientific information (by not having in-line citations), but is still scientific writing (the subject of the book is traditional ecological knowledge, written by an expert in the field), I conclude that the book Braiding Sweetgrass is a non-academic scientific source. 

Peer-reviewed academic scientific research.

Kimmerer, R. W. 2005 Patterns of Dispersal and Establishment of Bryophytes Colonizing Natural and Experimental Treefall Mounds in Northern Hardwood Forests. The Bryologist 108(3): 391-401

Type of scientific information: Peer-reviewed academic scientific research.

Written by an expert in the field

  • Also written by Robin Wall Kimmerer, but this time explicitly affiliated with SUNY-ESF.
    • her institution is printed below her name on the first page

Has in-text citations

Has a bibliography

Is peer-reviewed

  • There is no acknowledgements section, but the paper’s timeline indicates several months passed between receipt and acceptance of the manuscript.
  • The journal, The Bryologist, states that all submissions will undergo, at minimum, two peer reviews.

Is original research, not a review.

  • The article has a methods and a results section

Because this article meets the requirements to be considered academic (written by an expert, and has both in-text citations and a bibliography), the journal says that all submissions are peer-reviewed, and the work presented is details of original research, I conclude that this scientific article is an academic, peer-reviewed, original research source of scientific information.

Post 1: Observations (Vancouver, Beach)

User:  | Open Learning Faculty Member: 


I have chosen a section of beach just north of Volunteer Park, in Kitsilano, Vancouver.

(49.2720355, -123.1693128)

Observations

General landscape

My first field observation took place on Friday, 12 February, from 12:17 to 13:06. The weather was cold (approx. -2 degrees Celsius) and overcast. According to Fisheries and Oceans Canada (tides.gc.ca), the predicted low tide was at 12:38 and was 3m (relatively high, the next low tide at 23:50 is predicted to be 0.6m).

IMG_5661

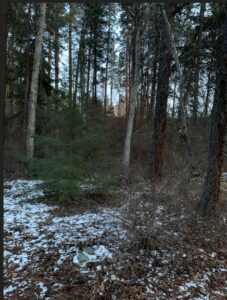
Figure 1. The beach north of Volunteer Park seen from the edge of the water at low tide, 12 February 2021. A. The entrance to the steps down to the beach. B. Hill slope, with some vegetation (mostly grass and ivy). The slope extends 2-3m, with an elevation drop of 4m. C. Big rocks and logs, extends 2-3m, 1m drop. D. Sandy beach, extends 4m, 1m drop. E. Intertidal zone, 14m to edge of water, less than 1m elevation drop. All measurements are visual estimates.

The selected site (Fig. 1) is the tidal area of the beach found down the steps from Volunteer Park.

Vegetation

On the hill there is trees, some grass, and (especially around the tree, close to the concrete wall to the east) some ivy. I saw minimal land vegetation past the large rocks.

I saw a few different kinds of seaweed, some more clearly different than others (Figure 2). They looked different but I will have to spend more time looking at the seaweed at the beach with an identification guide in order to know. The only seaweed that was further up on the beach was the reddish-brown “finger-leaf” seaweed.

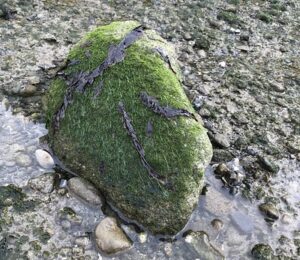
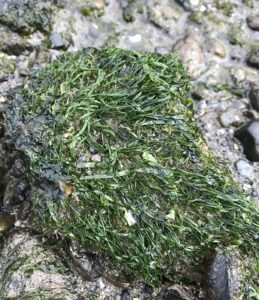
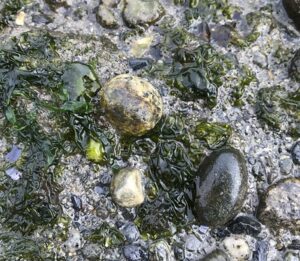
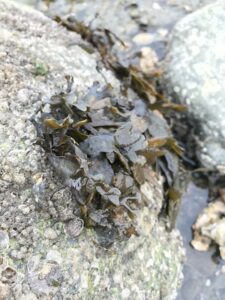
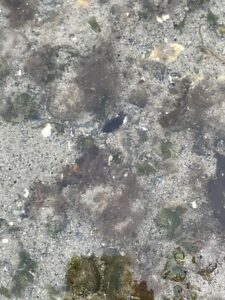
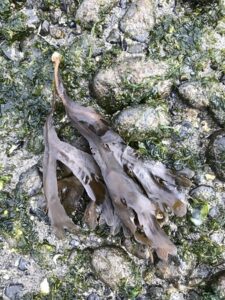
Figure 2. Photographs of seaweed found at the beach site. First to last: “mossy” green seaweed, “kind-of-mossy-but-with-longer-strands” green seaweed, “slimy-sheet” green seaweed, “finger-leaf” greenish-brown red seaweed, “fuzzy” red seaweed, “finger-leaf” reddish-brown seaweed.  

Animals

From the big rocks down through to the edge of the water, I found many shells both whole and in fragments. I could identify lots of mussel and oyster shells, and fewer clam shells. (Fig. 3) Living examples of all of those were in the wet intertidal zone. (Fig. 4) Towards the bottom of the sandy beach, very little sand was visible because of the amount of small pieces of shell.

IMG_5664

Figure 3. Shells found on the sandy beach. A. Oyster shell. B. Mussel shell. C. Broken clam shell.

IMG_5674

IMG_5675

Figure 4. Top: Mussel attached to rock. The hairs of the “beard” are visibly connecting the animal to the rock. Bottom: Oyster in a shallow pool, covered in barnacles. 

I also spotted evidence of buried animals. I found holes in the mud of varying size (Fig. 5), saw a couple spurts of water (as some clams do), and what looked like the open razor-edges of buried mussels (Fig. 6).

IMG_5680

Figure 5. Small holes in the mud in the intertidal zone.

IMG_5691

Figure 6. Open shells of bivalves, underwater. 

Barnacles were visible on most hard surfaces in the intertidal zone, including rocks and other animals (Fig. 4 bottom). I did not witness any barnacles open to catch food.

The most prevalent birds were crows, with some seagulls mostly flying overhead, and a few Barrow’s goldeneye ducks swimming near the water’s edge. The crows appeared to be digging in the intertidal mud, and varied in group size from individuals to large groups (Fig. 7). They were often quite noisy.

IMG_5682

Figure 7. Crows in the intertidal zone.

Surprisingly for me, considering the cold weather, I also saw some small flying insects walking on some of the rocks (Fig. 8). They moved quickly.

IMG_5688

Figure 8. Small winged insects, seen moving on rocks in the intertidal zone. Three individuals are circled in red. 

I did not see any sea stars, anemones, or jellyfish, all of which I have seen before at low tide on beaches in Vancouver. It is possible this absence is because the low tide at the time was not very low, but also I have not looked closely at this beach before and they may only be present elsewhere.

People

This beach is located in between Kitsilano beach and Jericho beach, and when the water is not too high, it is a popular spot for taking a walk. While I was there, many people walked past. Some people were just out for a walk, but many also had dogs. Most of the dogs were unleashed, and often ran in the intertidal zone. I especially noticed dogs occasionally chasing the crows.

Note about identifications:

Any animals identified above are not listed with the Latin binomial names because I did not consult a guidebook, so the identifications are just from my own previous knowledge, to the best of my ability, and may not be exact or fully accurate. In my next field observations, I hope to be more specific as I narrow the focus of the field study.

IMG_5710

IMG_5711

IMG_5712

Potential Research Questions

  1. How do the species of animal vary from the upper- to the lower-intertidal zone? Are some species or animal types restricted to one section of the intertidal zone? Is there variation between individuals (eg. size) of a species as they get closer or further from the top of the intertidal zone?
  2. What are the different species of seaweed present in this area? Do they vary in distribution? Are some seaweed species often close to particular animals?
  3. What is the effect of people on the activity in the intertidal zone? Does the presence of unleashed dogs reduce the number of birds?

Blog Post 4: Sampling Strategies

User:  | Open Learning Faculty Member: 


Systematic sampling had the fastest sampling time with 12 hours and 6 minutes. This makes sense as the plots used are fairly close together, reducing travel time. Both random sampling and haphazard sampling had estimated sample times around 13 hours, which accounts for their increased distance between plots.


As a species becomes more abundant, the accuracy of the results increases. The average percent error for the most abundant and second most abundant was 11% and 23% respectively. In contrast, the average percent error for the least abundant and the second least abundant was 46% and 113% respectively. This may be because the less abundant species are grouped together so it is much more likely for a plot to have none of that species or a much larger density of that species than its overall density. More abundant species may be more evenly dispersed throughout the study area, resulting in a more accurate representation of them in each plot.


In this scenario, random sampling was the most accurate with an average of 35%. It was also the most consistent in its results without a single result that was extremely high or low. Haphazard sampling got very small percent errors for three of the species, which can not be attributed to anything but luck, since I chose each plot using the “subjectively without preconceived bias” method. The transect used for the systematic sampling did not cross any areas where the two least abundant species were present, which accounts for its high percent errors for those species.

Results: https://photos.app.goo.gl/SgsjpzLhps1ZcRAYA

Blog post 9: Reflections

User:  | Open Learning Faculty Member: 


This was my first time conducting a field research project. As I anticipated, it was quite challenging to conduct field experiments through correspondence studies. With no previous knowledge in research methods, when it came to analyzing and discussing my data, I felt unprepared and lost but I did learn so much and appreciate the process.

My challenges were more based on trying to figure out what I wanted to research and how I was going to develop it. Accumulating the data was easy for me but to analyze it without any background in research methods was where I lacked insight.

From the start, seasonal and climatic variables affected my data collection; it rained most of the summer, and at the peak of vegetation cover, it was difficult to see ant activity. In the spring, I couldn’t identify the vegetation so I decided that I wouldn’t keep track of identifying shrubs, grasses, and trees. I did, however, have a good idea of the general species community of my site.

There was very little research supporting my hypothesis, and that was another challenge. There was no mound in my study which was a bit frustrating because I initially wanted to study correlation of mound presence, soil type and vegetation cover. I soon realized that my topic was quite complex and that ideally this study would be more successful if it was conducted over a longer time frame.


Blog 8: tables and graphs

User:  | Open Learning Faculty Member: 


Because of time and weather constraints, I had to work with very little data. However, with what I was trying to accomplish, the collection of data was fairly straight forward and deciding on a visual representation took me a little longer. I was initially going to just keep a table with my figures because my variables are mostly categorical, but I was able to create two of the 3 variables that were most important. The data does not show a pattern at all so it did generate more questions and these will be explored in my discussion. I was disappointed that there was no significant pattern, but this might be explained due to flood disturbances over my ecotone gradient of the site.

Creating the graphs was challenging because I also had to learn how to use excel and trying to figure out how to create a table that can be converted into a graph the way I wanted. In the end it worked out pretty good.

Blog Post 3: Ongoing Observations

User:  | Open Learning Faculty Member: 


For my study, I will be looking at western red cedars (Thuja plicata). For the environmental gradient, I focused on a gradient going from no trees of any species to abundant cedar trees.

The first location had no trees of any species. It was a rocky meadow, where there is very little soil on the surface of the bedrock. The bedrock is mostly covered in a layer of moss that is about 3.7 cm thick  with occasional patches of completely exposed bedrock (see photos for data and species – this data will not be used for my study as the thickness of the moss is dependent on its species but I thought it would be interesting to include it in my description here). The most common moss present was Oligotrichum parallelum. This location had the most moisture of the three locations I observed on the gradient. Water pooled around my feet as I stepped on the moss and there were small puddles in the depressions of the rock.

The second location was on soil with a layer of moss about 6.6 cm thick. The most common species of moss was Kindbergia oregana and there is not a single patch of exposed soil. This location had lots of other low-growing plants, arbutus trees and Douglas fir trees, but no cedar trees. This location was less moist than the last, but still moist enough that my feet would’ve gotten wet if they were not already.

The third location had thinner, more patchy moss and there isn’t a dominant species. There are many sections of exposed soil and lots of debris from fallen branches. I observed 10 living cedar trees from where I was standing and many more that were dead. Moss did not grow at the base of the living cedars but it was much more common at the base of dead cedars. This location was the driest, as it didn’t have as much moss to hold water. My feet would’ve stayed dry if I had stayed in this location!

My hypothesis is “The distribution of Thuja plicata is affected by the biomass of moss present.” and I predict that “Both Thuja plicata and a large amount of moss will not be present in the same location.” The response variable for this study is the presence of cedar trees and the explanatory variable is the biomass of moss. The response variable is categorical and the explanatory variable is continuous.

Link for the photos (I apologize for the slightly blurry parts):

https://photos.app.goo.gl/vAx3R94qfCTjG77w8