Recent Posts

Blog Post 5: Design Reflections

User:  | Open Learning Faculty Member: 


During my data collection, I did notice some difficulties in my sampling strategy that would affect my data collection. Firstly, I noticed that my stride length could change between each sample. To mitigate this variance in the future, I will use a tape measure to measure 10 m before each sampling collection. Additionally, trees impeded straight lines and made it difficult to keep my direction. To mitigate this variance I asked a friend to alternate measurements in order to have one person stand in the previous collection spot and ensure that the next data sample is collected in a more precise direction from the compass. These modifications will help ensure that sampling bias is mitigated in that each walking distance is the same and the walking direction is as accurate as possible to the direction generated.

The data that I have collected to this point appears that it will support my hypothesis that Virginia creeper has a higher probability of being present in areas that have less anthropogenic activity. I found it interesting that the appearances of Virginia creeper differed in the sanded area than in the regrowth and old-growth areas. The Virginia creeper in the sanded area was largely smaller plants in bunches, whereas, Virginia Creeper in the regrowth and the old-growth area had extended vines covering large sections and climbing trees in some areas.

Field Research reflections

User:  | Open Learning Faculty Member: 


This was my first time doing field research and it went better then I thought because of that. I did have challenges with weather changing at first but once I found a time of day that was relatively consistent it went much better. Writing the field report was also challenging for me. Making sure all the data I had was in the right section and used correctly was difficult. I have a greater appreciation for  scientists that do this type of work regularly. Environmental ecologists have to contend with so many elements that are out of their control that I have a greater appreciation for them in particular. When conducting field research they cannot control the weather or other disturbances that may affect their study. Events like that can really affect the outcome of a study. Taking into account all the elements they cannot control is a lot of work. Even for my little study not being able to control the weather made it hard at first to conduct.

Post 4: Sampling Strategies

User:  | Open Learning Faculty Member: 


In the virtual forest tutorial, using the area-based method for samples taken in the Snyder-Middleswarth Natural Area, the data collected in the haphazard method had the fastest estimated sampling time of 12 hours, 26 minutes.

From the collected data set we can gather that the most common species is Eastern Hemlock and Red Maple. The actual density for each is 469.9 and 118.9, respectively. The data set for the systematic sampling method provided the lowest percent error for each species at 4.7% for Eastern Hemlock and 2.4% for Red Maple. Conversely, the random sampling method resulted in the largest percent error at 25.5% for Eastern Hemlock and 120.8% for Red Maple. Comparatively, the rarest species sampled, the White Pine and Striped Maple held different results. The data set for haphazard sampling resulted in the smallest perfect error at 1.2% for White Pine and 18.9% for Striped Maple. Interestingly, both White Pine and Striped Maple concluded to the same largest percent error through random sampling at 100%.

It is notable that overall, the higher the actual data of species and collected data of species presented results with lower percent error. The average percent error for Eastern Hemlock was 13.7%. However, the rarest species, White Pine, had the next lowest percent error at 41.2%

The data set collected resulted in the systematic sampling method having the smallest percent error overall at an average of 10.8%, which was closely followed by the haphazard sampling method at 11.6%.


Table 1: Summary Data Set of Snyder-Middleswarth Natural Area Comparing Density with Area-based Methods


Species Systematic Random Haphazard
Actual Density Data Percent Errora Data Percent Error Data Percent Error
Most Common:
    Eastern Hemlock 469.9 448.0 4.7% 350.0 25.5% 520.8 10.8%
  Red Maple 118.9 116.0 2.4% 262.5 120.8% 137.5 15.6%
Rarest:
  White Pine 8.4 8.0 4.8% 0.0 100.0% 8.3 1.2%
  Striped Maple 17.5 12.0 31.4% 0.0 100.0% 20.8 18.9%
Estimated Sampling Time 12 hours, 41 minutes 12 hours, 45 minutes 12 hours, 26 minutes


aThe calculation used in finding the value of percentage error for each category is:
(E – T)/T*100, where E = estimated value and T = true value

Table 1 contains the summary for my findings for each species, eastern hemlock, red maple, white pine, and striped maple through systematic, random, and haphazard sampling in the Snyder-Middleswarth Natural Area. The table compares actual density of each species to the gathered data I found during sampling and the amount of time it would take to produce these samples.

Post 3: Ongoing Field Observations

User:  | Open Learning Faculty Member: 


Identify the organism or biological attribute that you plan to study.

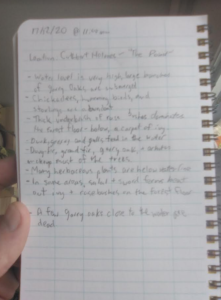
The organism I will observe is the presence or absence of the Parthenocissus quinquefolia, more commonly known as the Virginia creeper. 


Use your field journal to document observations of your organism or biological attribute along an environmental gradient. Choose at least three locations along the gradient and observe and record any changes in the distribution, abundance, or character of your object of study.

I visually divided my observation area into three transects; the areas include a clear cut section where sand has been spread to form a makeshift road, a small area where regrowth is forming that had been selectively cleared, and an area that has only been affected by natural treefall.  Changes of the Virginia creeper along the gradient includes the abundance, having a larger presence in the old-growth area than in the regrowth area or on the sandy road. The size of the Virginia creeper also differed. In the old-growth area there were many clumps and expanding vines, in the regrowth area there were smaller clumps with a few vine shoots, and finally, on the makeshift road there were fewer smaller clumps few big enough to shoot vines.


Think about underlying processes that may cause any patterns that you have observed. 

Underlying processes that may cause patterns in my observations include differences in soil nutrients as well as different compositions resulting in the inhibition or deterrence of Virginia creeper to grow. On the makeshift road and regrowth area the size of the Virginia creeper plants and their density could be smaller because there is greater anthropogenic activity, the sand adds an extra layer of soil to grow through, and plants haven’t had as much time to regrow in these areas. 


Postulate one hypothesis and make one formal prediction based on that hypothesis. Your hypothesis may include the environmental gradient; however, if you come up with a hypothesis that you want to pursue within one part of the gradient or one site, that is acceptable as well.

My hypothesis is plant richness of Virginia creeper is negatively affected by anthropogenic activity.

One prediction is that the plant richness of Virginia creeper will be more abundant in areas with less anthropogenic activity.


Based on your hypothesis and prediction, list one potential response variable and one potential explanatory variable and whether they would be categorical or continuous. Use the experimental design tutorial to help you with this.

The response variables in the experiment included the absence or presence of the Virginia creeper. Given that the dependent variable(the presence or absence of Virginia creeper) is dichotomous, categorical I would test the hypothesis using logistic regression. The predictor variable is the locations (also a categorical variable).  This is a categorical logistic regression design as the observation is to determine the overall presence of Virginia creeper growing in each transect.

Post #5 Design Reflections

User:  | Open Learning Faculty Member: 


I would say that all in all, collecting the data for my field study was fairly straightforward and I believe it was an effective way to get the information required by my hypothesis. Some of the notable difficulties I faced in collecting this information was that the quadrats were muddy and wet to get to as the cattails grow on the edge of a pond and the season had the ground very waterlogged, as well as the cattails are quite tall compared to me so I brought along a taller person to help verify I was getting the right numbers. However, I would collect data the same way in the future. I was able to guarantee the measurement of my quadrats easily and the random step generator made it so that I was still collecting from random sample sites even though my species of study occurred along a straight line around the lake. The data that I collected was surprising in that when I did the initial observations, I was sure that the more crowded areas had more intact catttails than the less crowded areas (as is predicted by my hypothesis) but the data did not show this pattern. But, as is science I suppose. If I were to make any changes, I would perhaps like to do more quadrats than five to see if that affected the results at all.

Blog Post 2: Sources of Scientific Information

User:  | Open Learning Faculty Member: 


I chose the review article “DLK2 regulates arbuscule hyphal branching during arbuscular mycorrhizal symbiosis” by Ho-Palagaro et al. The receptor in question has been elucidated to have implications in mycorrhizal chemical ecology, namely in distingushing between strigolactones and karrakins.

This is an example of academic, peer-reviewed research material. It is published in the journal New Phytologist, which only publishes peer-reviewed papers. It is primary research, since the authors carried out their own study and data analysis, rather than synthesizing information from the existing literature. The attached image outlines New Phytologist’s policies.


Blog Post 1: Observations

User:  | Open Learning Faculty Member: 


I have selected a section of Cuthbert Holmes Park in Saanich as my area of study. Cuthbert Holmes is a municipal park, under the jurisdiction of the District of Saanich. The park itself is around 26 hectares, but the area I will focus on (referred to as “The Point” on park maps) is around half an acre. It is a relatively flat estuary abutted by a young forest. This park stands out to me for two reasons.

First, it marks the headwaters of Portage Inlet, an urban estuary which runs through the Capital Regional District. Portage Inlet and the Gorge Waterway are host to a wealth of urban wildlife. This section of Cuthbert Holmes Park stands out for it’s mudflats, a brackish marsh area which marks the transition from freshwater stream to estuary. Currently, the mudflats are almost entirely flooded, which as I understand happens seasonally. Previously, the area was home to Vancouver Island’s largest blue heron rookery (https://www.saanich.ca/EN/main/parks-recreation-community/parks/parks-trails-amenities/signature-parks/cuthbert-holmes-park.html), and although the birds are not currently nesting here they still use the park’s waters for feeding.

The second reason this location stands out to me is its history. Previously under industrial and agricultural tenure, the area has been restored in the last few decades. This includes the salmon habitat of Colquitz Creek, the waterway which flows into Portage Inlet. I would like to take the opportunity to observe how this park continues to rebound post-restoration. The portion of the park I have chosen to focus on is right on the margin of development: on one side of the mudflats are residential backyards, while the other side is young second growth coastal douglas-fir forest. The invasive Himalayan blackberry (Rubus armeniacus) and English ivy (Hedera helix) have overtaken the margins and the understory of the area, respectively. Some grand fir (Abies grandis), arbutus (Arbutus menziesii), Garry oak (Quercus garryana) and many douglas-fir (Pseudotsuga menziesii) make up most of the tree species in the adjacent forest.

I’m visiting the park with ecological observation in mind for the first time today, December 17th. It is late morning on a relatively warm, sunny day.

Potential questions to explore:
-The Saanich website claims that bald eagles are to blame for the disappearance of blue heron rookeries. What other factors might be keeping blue herons from nesting in the area?

-In the areas overrun by blackberries and ivy, what effect are invasive species having on the overall species composition? Do these effects ripple down through different trophic levels?

-Garry oak are a drought-adapted species of tree. The Garry oaks at the edge of the water are subject to seasonal flooding. I wonder if these trees established at a time when the mudflats were drained for agricultural purposes. Is it possible that the Garry oaks situated below the flood line are less fit than the trees which are not exposed to seasonal flooding? Are these trees ultimately destined to succumb to flooding stress?


Blog 9

User:  | Open Learning Faculty Member: 


Blog Post 9: Field Research Reflections

Create a final blog post that reflects on your field research. You both designed a field experiment and then carried it out. Did you have any issues with the implementation or have to make any changes to your design? Has engaging in the practice of ecology altered your appreciation for how ecological theory is developed?


I had to alter my design several times and had to return to my site and review my notes and photographs many times. Doing this research was very interesting, but a lot harder than I had thought. Whenever I thought I had figured out the best way to collect and analyze my information, I would learn more from reading different studies in the course reading and finding better ways (I hope) to do the study. Also, the weather and seasonal aspect of it makes it a lot harder than some other types of research. The plants that I was trying to study changed throughout the semester from lush to shriveled to now I can’t even see them as of today. That made it difficult when going back to look for certain individuals to confirm my data. Luckily the many photographs really helped.

Engaging in the practice of ecology has definitely altered my appreciation for how ecological theory is developed. It is difficult, but very interesting and I hope that I can do more in the future, with what I have learnt.

Blog 8

User:  | Open Learning Faculty Member: 


Blog Post 8: Tables and Graphs

Create a blog post discussing your table or graph. Did you have any difficulties organizing, aggregating or summarizing your data? Was the outcome as you expected? Did your data reveal anything unexpected or give you any ideas for further exploration?


I had some difficulty with aggregating my data. I changed my design methods throughout, as I discovered what wouldn’t work. I finally gathered enough data and made a scatter plot to investigate correlation. I then did a Pearsons correlation calculation and it showed a strong correlation value. As with most research though, it created more questions. My research review indicated that poison ivy preferred sun over shade. Most of the plants however were located in part shade. I justified this based on the correlation to fruit bearing plant locations. I had predicted that the seed eating birds that dispersed the fruit seeds, also dispersed the poison ivy seeds in the same area. The strange thing is that there is NO poison ivy at all, just across the trail, only a few paces and this area is full sun and so preferable to growth. It seems strange that birds wouldn’t have at least dispersed some seed on that side of the trail. I wonder if maybe there is another unknown variable stopping it from growing on that side. I think that next year, just for my own interest, I will check it out and see if the distribution is still the same.

Post 7

User:  | Open Learning Faculty Member: 


Blog Post 7: Theoretical Perspectives
Create a blog post where you briefly discuss the theoretical basis of your research project. What ecological processes might your hypothesis touch on? For example, in the buttercup sampling videos, Dr. Baldwin’s research is concerned primarily with reproductive (and evolutionary) fitness, but also relates to pollination. What ideas underpin your research? When you submit a research article for publication, you need to provide several keywords that summarize what your research is about. For example, a paper published from the research described in the wetland sampling videos included depressional wetlands, disturbance gradient, functional groups, and livestock grazing as keywords. Please list three keywords that you could use to describe your research project.

Three keywords I would use are seed dispersal, berry and fruit feeders and light preferences. I would use these keywords because I am assessing the correlation between poison ivy and other fruit growth. The seed dispersal refers to how the poison ivy and fruit got where they are, the berry and fruit feeders functional group refers to who got the seeds there and the light preferences refers to other variables taken into account for poison ivy distribution.