Recent Posts

Blog 6

User:  | Open Learning Faculty Member: 


Blog Post 6: Data Collection
Create a blog post describing your field data collection activities. How many replicates did you sample? Have you had any problems implementing your sampling design? Have you noticed any ancillary patterns that make you reflect on your hypothesis?

I had to change my collection design, as after trying to collect data a few times, I realized it wouldn’t work the way I was doing it. I am trying to see if there is a correlation between where fruit plants grow and where poison ivy grows and if there are any other contributing factors for where the poison ivy is growing. I had tried out just randomly selecting plots to check for poison ivy and fruit plants, using a random generator app. The problem is that then I don’t always get many poison ivy plants in my data. (I tried this method a few times). My last attempt at data collection involved instead, systematic sampling along a transect. This is what I had tried on my very first data collection, but I had to add more quadrants this time to get enough data.

Blog 5

User:  | Open Learning Faculty Member: 


Blog Post 5: Design Reflections
1. Create a blog post to discuss the collection of the initial data in Module 3. Did you have any difficulties in implementing your sampling strategy? If yes, what were these difficulties? Was the data that you collected surprising in any way? Do you plan to continue to collect data using the same technique, or do you need to modify your approach? If you will modify your approach, explain briefly how you think your modification will improve your research.

My initial data showed some support for my hypothesis but wasn’t enough data to really be strong. I think I will need to adjust it somewhat to be able to check more samples.

2. Read some of the blogs done by other students in this course and look over the hypotheses that they are investigating. Please offer constructive criticism of one other student’s hypothesis. Post this feedback as a comment on their blog. Topics to consider for feedback include: is the prediction clear and falsifiable, are the pieces and patterns under investigation clearly stated, do the predictor and response variables seem easily measurable in a field setting, and are there any potentially confounding variables that the investigator should be concerned about.

Post 5: Design Reflections
Posted on November 4, 2020 by tparekh
When I originally started gathering data, I tried keeping track of all the species that had percent coverage over 10%. In some of the quadrats there were 5 or 6 different species, so I have decided to only tabulate the most prevalent 2 or 3 species. From looking at all the quadrats the vegetation that seems to be the most common in all regions is the veiny meadow rue and cow parsnip.
When looking specifically at veiny meadow rue there seems to be a clear line moving horizontally across the hill that could define the floodplain. My hypothesis is that vegetation species and their percent cover will either decrease or increase in relation to their proximity to the stormwater pond. Vegetation such as cow parsnip will be more common regardless of distance from the stormwater pond as it is a more versatile species.
When selecting my quadrats I could have used a more methodical approach. Instead of blindly tossing a ball and then creating a quadrat around that I kind of “randomly” selected my quadrats based on what I thought would return the best quality of data that I could use. In that sense, the data presented may not accurately depict the actual percent coverage of vegetation in the 4 zones being studied.
I could have also increased the size or number of quadrats as larger species would naturally occupy more percent of a 1m x 1m quadrat and a larger quadrat or more quadrats would be able to more accurately display the percent coverage of smaller vegetation species.
These samples were not collected in the spring months, but I think it would have been interesting to see how vegetation would have responded to the melting and constant flooding that would be experienced. Maybe if there were larger amounts of snow that was melting then flooding would be more prevalent which could push vegetation boundaries up to higher elevations as opposed to a lighter winter where not as much snow would melt and vegetation boundaries may be at lower elevations.
It would be interesting to see these boundaries in relation to the amount of snow fall from the previous winter and see if there was some correlation between the two.
My reply:
This sounds like very interesting research! I think you are right about increasing the number of quadrants to capture the small vegetation more accurately. I had that issue with my study as well and found that I wasn’t able to capture enough data with the amount of samples I had initially taken.

Blog#4

User:  | Open Learning Faculty Member: 


Blog Post 4: Sampling Strategies
Create a blog post describing the results of the three sampling strategies you used in the virtual forest tutorial. Which technique had the fastest estimated sampling time? Compare the percentage error of the different strategies for the two most common and two rarest species. Did the accuracy change with species abundance? Was one sampling strategy more accurate than another?
I looked at the Mohn forest for the exercise. I found that the time spend was approximately the same when using the haphazard and random methods for area, with the random taking slightly less time. The haphazard strategy resulted in more species found (richness) and more plants counted. In this particular situation though, I think the random method is better because the forest is a quite patchy, having had many disturbances. If it was the Snyder forest, which is quite homogenous, randomness wouldn’t be as important.

Blog Post 8: Tables and Graphs

User:  | Open Learning Faculty Member: 


My figure was relatively easy to put together. It showed the mean number of stems/quadrat counted in each of my treatment areas. As it was a simple comparison between the treatment areas and means, it was not a problem to describe or summarize.

The outcome of the figure was as expected with the calculated values matching what had been visually observed in the field.

The data did give me an idea for further research. The differences in mean values was fairly large and I am wondering if there might be more at play than just mowing frequency that is causing the different growth patterns in the vine.

Post #2: Sources of Scientific Information

User:  | Open Learning Faculty Member: 


The source of ecological information that I have selected for this blog entry is “Effects of high temperatures on photosynthetic capacity in the leaves of creepers”,  a journal article posted online from the ScienceAsia journal. The link to the article is as follows:

http://www.scienceasia.org/acconline/060-2019-0800.pdf

The article is classified as an academic, peer-reviewed research material. The authors Yuan Xue-Tao, Li Fu-Ping, and Gu Hai-Hong are associated with the College of Mining Engineering at North China University of Science and Technology, the Hebei Key Laboratory of Mining Development and Security, and the Hebei Industrial technology Institute of Mine Ecological Remediation in Tangshan. Following the article, the authors have included an acknowledgment, however, in this section peer-reviewers are not listed. Nonetheless, the ScienceAsia journal only publishes peer-reviewed articles, therefore, we can assume that it was peer-review before being published.

In the body of the article, sections were created to list the materials and methods of the conducted research, including the location, measurements of chlorophyll content, gas exchange, and chlorophyll fluorescence measurements. Following the presentation of their collected data sets, the authors provided a section for discussion on their findings and interpretations of their data.

Post #1: Observations

User:  | Open Learning Faculty Member: 


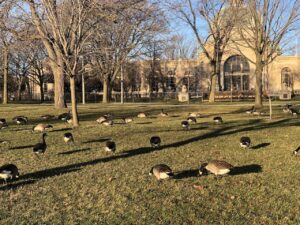
The study area I will be examining is located in an urban neighborhood in Lamar County near Hattiesburg, MS. The area I have selected includes a cleared section that was covered in red clay and sand to create a makeshift road, a partially cleared forested area where the soil is a mixture of transported sand and native soil to the area and regrowth has taken place, and an old-growth section that was not influenced by anthropogenic means during the creation of the road.

My observations began in a section that had been cleared and made into a small road that transitions from sand to concrete-like red clay. In this area there is no vegetation, however, I have found deer, raccoon, and bird footprints in this section. The red clay road makes a small incline into a semi-cleared forested area where the soil has a mix of sand from the road and native soil. Since being cleared regrowth has begun to form where the road was. This area transitions into a more heavily forested area where only natural clearing has occurred. 

I visited the location on October 18th, 2020, it was 11:30 local time and there were few clouds splattering the sky. It was 28 degrees celsius.

Notably, the plant diversity and richness varies over the gradient from the transition of the sanded road to the forested area as well as the size of the plants. Additionally, I observed that the presence of animals was more pronounced on the sanded road where the sand could capture tracks than in the treed area where animal presence was more easily disguised. 

Questions of interest I had included:

  1. Are the types of plants in the different gradients all native or are any of the plants invasive to the area?
  2. How do precipitation and sunlight impact plant growth in each of the different areas?
  3. Will the edge of the old-growth area influence the speed and types of species that grow in the regrowth area?
  4. Which area is more likely to have the largest Are animals more likely to be found in the old-growth area where there is less anthropogenic activity than on the sanded road?


Below is a drawing of the observed area:

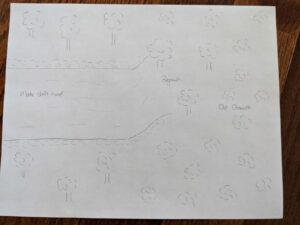
Figure 1: Illustration of observed area including makeshift sanded road, regrowth area, and old-growth area.

Blog Post 8: Tables and Graphs

User:  | Open Learning Faculty Member: 


Based on my data I created a table as my data is best suited to that form of depiction. I struggled at first setting my data in the table as there are many components to it that are connected, but need to be viewed separately as well. After reading the articles for the course and seeing how the tables were organized I came up with a solution that worked well for my table. The outcome of my study was what I expected as the results indicated that vegetation is a major factor in the amount of ants present in a given area. An area that I would be interested in exploring that arose from my data is how weather may affect the amount of ants seen. I live in an area that has very windy periods, especially in the winter. I found that on the days when it was windy there were no ants presents. Exploring this further could prove very interesting.

Blog Post 9: Field Research Reflections

User:  | Open Learning Faculty Member: 


This was a completely new process for me. Developing and implementing my experiment came with many challenges. I was often second guessing myself and certain stages of the experimental design took much longer then anticipated. I also realized that at a certain stage there is no turning back even if you are not pleased with everything. A lot of time goes into a good field project. I ended up doubling the amount of samples I collected because I realized that I did not initially have enough to minimize bias.

I have gained an appreciation for the amount of effort, time, and hard work that goes into a successful research project. This came as somewhat of a surprise to me, considering the simplicity of my project in comparison to other research work. I was reminded that ecological theory takes time to develop and it is only as good as the relevant work from other ecologists. This point highlights the need for quality and quantity of literature in order to speak of any given topic with a reasonable level of certainty.

Post #3: Ongoing Field Observations

User:  | Open Learning Faculty Member: 


  1. Identify the organism or biological attribute that you plan to study. Canadian Geese 
  2. On the grass: every goose is more spread out from one another. Their distribution is more spread out and everyone is picking at the grass, looking for something to eat. There are a lot ~30 geese presentBy the trees: in the summer months the geese were either under the trees or some of them were in the sun (sunbathing). they were always in groups thoughOn the lake: only a few left the group to go to the lake but they always go in groups. Around 6-7 of them were present on the lake and they peck at the water at first and stood by the riverside and then eventually went in the lake with some of them swimming and some still on the edge.

  3. Think about underlying processes that may cause any patterns that you have observed. A: All of the geese stay in pairs, even though they may be spread out from another, they are always together.  Postulate one hypothesis and make one formal prediction based on that hypothesis. Hypothesis: What is in the habitat of Canadian Geese that causes them to gather in large numbers? What food sources do Geese look for on the grass?
  4. Based on your hypothesis and prediction, list one potential response variable and one potential explanatory variable and whether they would be categorical or continuous. Use the experimental design tutorial to help you with this.

Response Variable: Which foods are rich in grasslands that cater to the diets of Canadian Geese.

Explanatory Variable: The types of food sources available. (Categorical)


Post #2: Sources of Scientific Information

User:  | Open Learning Faculty Member: 


One ecological information source is a website called allaboutbirds.org. It is an organization that gains information from other sources. The source is -> https://www.allaboutbirds.org/guide/Canada_Goose/lifehistory#

b) I would classify it as academic material that is not peer-reviewed.

C) Even though they have credited their sources of information, it is more of an information website to gain information on the topic(s) one’s interested in rather than a formal peer-reviewed piece of work.