Recent Posts

post 7: theoretical perspectives

User:  | Open Learning Faculty Member: 


For my research project I am exploring the relationship between soil moisture and bracket fungi (Polyporales) growth in a section of Boreal Forest in the southern Northwest Territories. My study site is comprised of mixed wood trees, a creek that drains into the Great Slave Lake and a boggy area south of the creek; I have taken soil samples and bracket fungi counts from these three distinct areas. Bracket fungi can be saprophytic or parasitic, meaning they absorb soluble organic nutrients from the host species, which in my case are intact trees, snags or stumps (Allaby, 2019). Through my hypothesis I am exploring the theoretical perspective that increased soil moisture is positively correlated with polypore quantity on trees in this region.  Extrapolating on this, the research also explores the possibility that moister environments lead to higher rates of decay, as evidenced by greater fungi quanity. My hypothesis therefore touches on the biotic processes of parasitism, decay, decomposition and fungi reproduction as well as the abiotic factors of soil moisture and position of affected trees within the study area. Based on the theoretical idea that fungi proliferate in moist environments which promote a more rapid rate of decay, my prediction is that there will be an increased count of polypores in wetter areas.

Keywords:  fungi growth, polypore/bracket fungi, soil moisture

Allaby, M. (2019). A Dictionary of Plant Sciences (4 ed.). Oxford University Press. DOI: 10.1093/acref/9780198833338.001.0001

Blog Post 6: Data Collection

User:  | Open Learning Faculty Member: 


Data collection at Mission Creek Regional Park is ongoing. Sample collection has been more efficient since reducing plot size to 100m^2. An additional area was selected to study approximately 500m east from the original site to increase the data pool, though this site has thicker brush which will make sampling challenging. To date, one of two study areas has been sampled (12 quadrats). Soil sample sites in each zone (riparian, floodplain, uplands) were selected, any further sampling is awaiting completion of a percolation test apparatus.

While it was initially observed Pinus ponderosa concentration was fairly constant through the gradient, it was since noted the tree characters change significantly. These observations have caused me to reflect upon my original hypothesis, warranting further investigation into stand make-up and quality, versus only tree concentration.

Post 1: Observations

User:  | Open Learning Faculty Member: 


Date: 14/05/2021


Time:  4:30 PM


Weather: 26 °C, Sunny, Humidity: 34%, Wind: 14km/h


Location: King’s Park in Winnipeg, Manitoba.


Topography: beside the bank of the Red River Lake


Vegetation: Forest + grassland


Observations:

The site that I chose to conduct my research in is King’s Park Winnipeg, Manitoba. It is a park and residential subdivision located on the Western side of the Red River bank. The park includes walking trails, an off-leash dog park area and marshland and some ponds creating edge habitats.  The space is about 592 x 270 m.


As I entered the park, the first tree species that caught my eye was White Spruce trees. Following the trail, I noticed the most abundant tree species to be Jack Pine trees. As I walked around the park, I noticed some ponds some of which were dried up next to the off-leash dog area. There are many different species of shrubs that can be seen near the forested area by the lake. Some of the shrubs that I identified are the Virginia Creeper (Parthenocissus quinquefolia), Common moonseed (Menispermum canadense), Poison Ivy, Garden Rhubarb, Common lilac, and Mercurialis perennis. Other species that can also be found at King’s Park are the Red-winged black bird, ground squirrels, and monarch butterflies. As I was walking through the forested area, I noticed a high abundance of different types of worms hanging from strings. Some of these worms were also seen on the ground since their strings might have been cut off due to human disturbances.


Questions:


  • Which shrub species dominate the area and what are the reasons behind it?
  • What are the anthropogenic effects on the lifecycle of worms?
  • Do the tree species composition change from the entryway of the park towards the forested area near the river?


blogpost1 

Blog Post #5 – Experimental Design/Data Collection Reflections

User:  | Open Learning Faculty Member: 


The original study area had to be re-evaluated as area size was noted to be a possible confounding variable, and also because one of the city parks staff completely destroyed one of the proposed study sites in early June. As a result, I decided to take a closer look at the main study area, and in doing so I noticed that there was a gradient in vegetation species richness already present in several areas of the Dufferin Wetlands Park. I decided to divide the main study area into four quadrants to conduct my data collection, and before collecting bird species data, I  surveyed each quadrant and counted the number of vegetation species present. Bird species data was collected from June 5-12, 2021 using the point counts sampling method.

The most pronounced difficulty in data collection that I noticed was the initial identifications of the bird species in the area. This was easily the most time-consuming task as some birds were extremely active and harder to identify than others. Once identifications were complete, I did not find the actual data collection replicates to be a difficult task, and found it to be relatively straight-forward.

At this point in time, I plan to make a few small changes but will ultimately stick to using this technique to collect data for my experiment. To explain, I will be adding a control site to the data collection, which will be a nearby parking lot. I will also attempt to control for the time of day by sampling data at the same times for each replicate, and also plan to standardize the point count sampling times for each area to 5 minutes. Cumulatively, I feel that these changes will help to produce more consistent data.


Blog Post 9: Field Research Reflections

User:  | Open Learning Faculty Member: 


The field project aspect of this course certainly opened my eyes to the difficulties and complexities in both designing and undertaking an ecological study. As I have a very limited background in carrying out field studies, I did find the broad and self-directed nature of this project difficult, especially in terms of selecting a project I could carry out myself appropriately. There were certainly a lot of adjustments that had to be made in terms of my sampling design and variables to assess. 

My sampling of multiple quadrats within multiple transects was definitely time-consuming, and I also feel I chose a project with too many confounding variables which created an added difficulty and stress when putting my project and data together. Luckily I was able to find a fair amount of relevant research that aided in describing the results of my study.

Although this has been by far my weakest course thus far in my degree, I have certainly gained valuable skills in critically assessing scientific articles, and more importantly, gained a valuable appreciation and understanding for the amount of work involved in creating a scientifically sound and unbiased field study. Lastly, it was a great change of pace to have a fully hands-on aspect to an online course, which enabled a practical application of the theory being taught.

Blog Post 8: Tables and Graphs

User:  | Open Learning Faculty Member: 


My study hypothesis was that the Broadleaf Stonecrop abundance is determined by substrate drainability (i.e most abundant in sites with either a high rate of water percolation or surface runoff). To demonstrate the results of my study, I plotted three graphs; one showing the relationship between substrate type and stonecrop abundance, one showing the relationship between degree of slope and stonecrop abundance, and a third showing the level of drainability and stonecrop abundance. 

The first two graphs depicted strong relationships between stonecrop abundance and both substrate type and degree of slope individually.

The most difficult part was assessing the level of drainability within each quadrat as it combines the effects of two variables, slope and substrate type. A high degree of slope is going to increase surface water runoff, while a coarser grained substrate is going to increase the rate of percolation, both of which lead to a higher rate of water being drained from the area.

My graphs generally agreed with my hypothesis and demonstrated that the abundance of Broadleaf Stonecrop responds positively as water is drained faster from the substrate. My results also demonstrated that there are other confounding factors, as to be expected, that are also determining the abundance of my study subject. I had established four levels of substrate drainability, and predicted that the well and rapid draining sites would have the highest abundance of stonecrop, however my results indicated that the well draining sites in fact did not have the predicted response. It was later suspected that this is due to another factor, proximity to the ocean, as the majority of the well-draining quadrats were found to be facing the lagoon, as opposed to open ocean.

Blog Post 6: Data Collection

User:  | Open Learning Faculty Member: 


Hypothesis:  Soil moisture affects presence and quantity of bracket fungi on mixed species trees in the Oxbow Trail Park.

Due to flooding that submerged large sections of my original study site, I elected to find a new site to complete my project. The area I chose is the Oxbow Trail park on Vale Island in Hay River, Northwest Territories. This park is comprised of wild mixed wood forest and creeks that drain to the Great Slave Lake and adjacent Hay River. It is largely untouched and sees very little foot traffic. For this reason, it is a good place to spot wildlife, including lynx, black bears and beavers. The other great thing about my new site is that unlike the first location, it is teaming with fungi. While I had a challenging time locating enough replicates at my original study site along the Kiwanis Trail, I quickly realized this would not be a problem in the Oxbow park.

For my initial study site I planned to run multiple transects and find the nearest polypore-infected tree for each transect. This strategy was chosen since the polypore-infected trees were quite rare, occurring only every 50-100 trees.

Since the presence of polypore-infected trees is plentiful at the Oxbow site, I decided to revise my strategy to incorporate stratified random sampling using randomly placed plots. I chose the stratified random technique because there were three distinct areas that I wanted to include: 1) The creek bed, 2) the forested area north of the creek and 3) the swampy forest south of the creek. I found plot coordinates using a random number generator. I sampled a total of 24 replicates, 4 from the creek bed, 10 from the north forest and 10 from the swampy south forest. This stratified breakdown gave a more accurate representation of the overall spatial context and distribution of trees.  16 of the replicates had polypores on them and 8 did not. I chose to study soil moisture content for trees without polypores to have a more complete understanding of the soil moisture distribution throughout the area.

Initially I only planned to count the number of brackets on each replicate and then take a soil sample from the base of the tree. However, during my field collection activities I felt it was also important to record additional details such as whether the tree was deciduous or coniferous, if the tree was alive or not, and if it was clustered amongst other infected trees. These additional findings may add more context to the study, however for the time being I am focusing only on the variables of # of fungi brackets and soil moisture content. I quickly discovered that many trees had brackets that extended far higher than I was able to count. Therefore, I only counted brackets up to diameter at breast height (DBH = 1.3) and then noted if multiple brackets were observed above this.

I initially planned on obtaining soil samples that were 20cm deep, however I found getting to this depth to be challenging due to roots, organic litter and the size of my spade. I therefore adapted my strategy and obtained all samples at a depth of 15cm, and tried to obtain approximately 100g of soil from each replicate.

To obtain soil weight and moisture content, I dried all the samples at 400 Celsius for 2 hours. Prior to drying, I weighed all the samples in the baggies that I collected them in, accounting for the weight of the bag. Once weighed, I placed the samples in the oven in batches. A few samples needed slightly longer to dry as they were very saturated. I considered the soil samples sufficiently dry when they crumbled easily, and no moisture could be felt.  I reweighed the dry samples, accounting for the weight of the bowl, and then calculated the moisture weight and the soil moisture content percentage.

Now that my samples have been collected and calculations are complete, the next stage will be graphing the data and looking for any patterns or trends which will either support or reject my initial hypothesis.
Blog Post 1: Observations

User:  | Open Learning Faculty Member: 


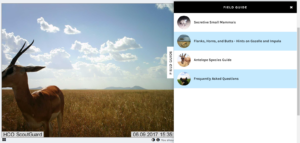
I have selected to observe the Serengeti ecological area through the use of the Zooniverse project, a platform for “people powered research”. The landscape of Serengeti National Park varies from woodlands to savannah to grasslands. Also, the climate ranges from warm and dry with a rainy period from March to May.

Further, this resource utilizes camera trap images and has been used in various publications. I will be utilizing the Snapshot Serengetti project to form a hypothesis focusing on the feeding behaviours of organisms.

Questions,

  1. Which organisms feed in groups (>2 individuals) and which graze individually?
  2. Does the presence of other animals from different species have an effect on whether or not an organism graze indvidually?
  3. Are there patterns that are species-specific?


Blog Post 9: Field Research Reflections

User:  | Open Learning Faculty Member: 


Creating an ecological study, collecting data, and turning the data into a scientific paper is a daunting task. Luckily the course was designed in a way that helps guide you along all of the necessary steps. In order to keep my research project fully objective I wanted to find a study subject with predictor and response variables that were clear and easy to measure. I chose to observe the internode length in wild roses (Rosa acicularis).

During initial data collection measurements of internode length were easily obtained as the stems were vertical and non-branched and the buds were small, yet clearly visible. Unfortunately by the time it was time for the major data collection, the buds had sprouted and had developed into small branches and leaves. This made measurement of internode length much more difficult as it was hard to place the tape measure in a position in which it ran parallel to the main stem and it was hard to see the measurements as the branches would obstruct the view of the tape measure. Although data collection was harder than anticipated, it was still possible to obtain all of the measurements necessary for this study.

Engaging in this study has revealed to me the amount of work required to derive even the most basic of ecological conclusions. The results of my study suggest that Rosa acicularis plants at the Queen Elizabeth Disc Golf Course in Vancouver, BC have optimized internode length and that the internode length is not significantly related to the height of the plant. In order to use this information for further research time consuming data collection would be required. To observe the impact of various environmental pressures on internode length in R. acicularis, plants growing in many different environments with varying levels of environmental pressures would be required.

The choice of sampling unit and how to randomize sampling was a foreign subject to me before this course. I have learned that is of upmost importance to select samples in an appropriate manor so that extrapolations can accurately represent the population as a whole. The exercise of conducting a research project has given me insight into how scientists derive ecological conclusions and has made interpretation of journal articles much as easier.

Post 7: Theoretical Perspectives

User:  | Open Learning Faculty Member: 


For my initial observations, I explored a section of intertidal zone (ITZ) on a beach at the north of Vancouver’s West Side. Oysters did not seem to be evenly distributed on the intertidal zone, and at I observed that they were more prevalent near rocks. The ITZ is subject to wave action from tides, weather, and frequent boat activity moving through this busy stretch of water. Rocks are able to act as breakwaters to absorb some of the kinetic energy of the water movement. (Dodaran and Park 2019) Oysters are fairly hardy, but they are still susceptible to the stresses of hydrodynamic force. (Wall et al 2005, Theuerkauf et al 2017) Relevant ecological processes that my study touches on are interactions between abiotic and biotic factors (water movement and oyster resilience) and ecological stressors (tidal action, wave energy).

From this theoretical basis, I hypothesized that oysters in the intertidal zone receive protection from rocks, which interrupt wave action and therefore reduce the force of water movement. To test this hypothesis, I observed oysters in the ITZ at four different sites between Kitsilano and Jericho beaches. For each oyster, I recorded whether it was behind or to the left or right of a rock (within a “shadow” the length of the rock’s height), or if it was not in any rock shadow (either because it was not near a rock or if it was in front of or on the front or top faces of the rock).

Key words: oysters, hydrodynamics, intertidal zones