Recent Posts

Post 9: Field Research Reflections

User:  | Open Learning Faculty Member: 


The beginning of this field research assignment definitely had its challenges for me. I did my research in a location I was not at all familiar with so it lead for several questions to figure out on top of figuring out what I wanted to research. In my original design implementation I was not sure how to collect effective data for my study. This lead to poor data that would not be a good contribution to my research. Once it was decided to take several measurements of individual branches of the randomly selected plants I was given a better overall understanding of my data. It painted a clearer picture of the plant I was studying. My research of this species also helped give me a good understanding of the functions of a plant that is commonly found. This definitely gave me a greater understanding and appreciation for how ecological theory is developed. In this case though, I would like to leave the research and studies to the professionals in the future and educate myself through their findings.

Post 8: Tables and Graphs

User:  | Open Learning Faculty Member: 


Blog post 8 graph

My graph represents the average branch length from the four branches I chose at each plant. I chose five different plants randomly at each transect to represent a larger proportion of the available study species. In organising my data for my graph I did have some difficulties. I was unsure how to best represent my data and how to show the comparison between the two transects. I decided to use a graph showing the two lines, one of each transect so the differences were clear. As well, when choosing the numbers I felt that showing the branch length of each plant I chose would become cluttered and unnecessary so I found the average branch length of each plant I studied. My data made me want to see this study on a larger scale to see if this would be common findings across the landscape.

Post 7: Theoretical Perspectives

User:  | Open Learning Faculty Member: 


My research is looking at the growth rates of Kinnikinnick in presence and absence of a canopy (or forest cover). Some ecological processes that may be involved is the difference in soil type in these locations as well as other competition in vegetation. As seen in several studies, different vegetation will grow in different locations. There may be other vegetation Kinnikinnick is competing with in these locations that is affecting the growth rate. In some of the areas I was completing my research in there was other species growing between the branches of Kinnikinnick. There could be potential that these plants root systems have effects on the root system of Kinnikinnick.

Keywords: Kinnikinnick, soil type, sunlight, exposure, vegetation

Post 6: Data Collection

User:  | Open Learning Faculty Member: 


I collected my data from two different transects. One located on Elbow River in Kananaskis, AB, the other from Ing’s Mine- across the highway from Elbow River. The Elbow River transect is located on a steep South-West facing slope with no canopy or other forest cover. The Ing’s Mine site is well shaded with a medium density canopy and underbrush. At each transect five separate kinnikinnick plants were randomly selected. There were four separate branches/trails from each selected plant that were measured for length of branch in inches. The Elbow River was measured in absence of canopy with direct sunlight where as the Ing’s Mine site was measured with presence of canopy with indirect sunlight. One problem that occurred with implementing my sample design was finding Kinnikinnick plants at the Ing’s Mine site that were not encroaching on each other (patchy distribution found under the canopy). A pattern found at the Elbow River transect was that the branch lengths were commonly around 22″ and the Ing’s Mine transect they were commonly around 7.5″. These patterns help show on a very small scale research site that my hypothesis: Forest canopy will negatively affect the growth rate of Kinnikinnick (Arctostaphylos uva-ursi) has potential proof.

Blog Post 6: Data Collection

User:  | Open Learning Faculty Member: 


To date I have gone out twice to collect field data at my grasslands site in Vernon BC. To this point I have sampled ten replicates. Each replicate is a different transect line along a slope gradient from a gentle lower slope position to a steep mid to upper slope position. On each replicate I have sampled 4 plots, totalling 40 plots. I have not had any particular difficulties implementing my sampling design.

A point of observation that I made on September 26th, on my second data collection day was that soil samples on the lower slopes demonstrated hydrophobic reactions to the water I added in conducting the texture analysis. I did not notice this pattern with the soil on the steeper slope position. This will be a point of further research into soil property characteristics.

I have not noticed ancillary patterns, however I have noticed that the vegetation has a quite a distinct zonation between gentle and steep slope sections, with predominately grasses on the gentle slope and forbs/shrubs on the steep slope section.

Post 7: Theoretical Perspectives

User:  | Open Learning Faculty Member: 


As I briefly discussed in blog 6 about other factors influencing my study such as, atmospheric temperature, disturbance, food preference and phenology –amongst other aspects– a few ecological processes are in question and are important to investigate and discuss to support/supplement my research and findings.

Some of the major ecological processes that are considered in my study are:

SOIL CHARACTERISTICS: HYDROLOGY, MOISTURE, TYPE, ACIDITY

  • Do thatcher ants have certain soil preferences? Does soil acidity, moisture, and type indicate habitat preference? Do these characteristics enable the composition of mound microclimate? According to Beatie and Culver (1977), Formica obscuripes can change mound soil chemistry and affect vegetation succession at the site.

RIPARIAN ECOSYSTEM: HYDROLOGY, VEGETATION, DISTURBANCE

  • Are thatcher ants a predominant species in riparian ecosystems? Is it due to the vegetation, substrate and soil availability? Are they known to be most resilient in these specific ecosystems? How do they contribute to this type of ecosystem?

COMMUNITY/SPECIES STRUCTURE: Success, fitness, resilience, tolerance, competition, indicator species.

  • Are thatcher ants more adaptable/resilient to riparian habitat? How are they indicator species?

PHENOLOGY: Climate, temperature, seasonality, food availability, life cycle, biological timing.

FUNCTIONAL ECOLOGY: Species function, abiotic processes, mound microclimate, nutrient cycling.

Keywords:

Formica obscuripes, western thatcher ant, soil type, soil moisture, ant fitness, mound microclimate.

Source:

Beatie, A. J., and Culver, D.C. 1997. Effects of the Mound Nests of the Ant Formica obscuripes, on the Surrounding Vegetation. The American Midland Naturalist. 97(2):390-399. https://www.jstor.org/stable/2425103


Blog Post 8: Tables and Graphs

User:  | Open Learning Faculty Member: 


Given that I am working with data from 10 transects with 11 quadrats each, I had a great deal of trouble organizing my data.  I took field notes in a Google Sheet and used Excel for calculations and data analysis from home.  There were a total of 25 forb species found in the study area and I collected moisture, cover and species abundance data; therefore, (including empty sets) I have 2750 data points (10 x 11 x 25).  It became clear very quickly that naming convention was extremely important when trying to arrange and analyze my data in a meaningful way.  For example: I initially designated my quadrats as T1Q1, T1Q2… T10Q11 (with the number succeeding the “T” being the transect number and the number succeeding the “Q” being the quadrat number).  However, when sorting data alphabetically, T10Q11 would be arranged between T1Q11 and T2Q1.  Therefore, I had to go back and change my naming convention to T01Q01, T01Q2 etc.  This seems like a simple thing, but it caused me a great deal of trouble and illustrated the importance of having “data management-friendly” naming conventions.  I will note that this is, certainly, not the only time I needed to go through and “clean” my data in order to facilitated organizing it in a logical way.

Concerning presenting my data: I struggled to find a singular figure that would readily summarize the overall trends in my project without being convoluted or confusing.  Therefore, I decided to submit a singular graph of the the Shannon-Wiener Index against distance (from the shoreline of the South Saskatchewan River).  I will also note that I did perform calculations for Simpson’s diversity index but have only included the Shannon-Wiener in my submission to avoid ambiguity.

I expected that forb species diversity would be highest at an intermediate area between the extreme ends (the shoreline and the uplands) of the riparian environment I was studying.  While this is true (Figure 1), I was not expecting that the highest level of diversity would occur that close to the shore.  In addition, I was not expecting that forb diversity would be so high approaching the uplands.  While not pictured in this graph (again, for the purpose of keeping it understandable), soil moisture steadily declines and elevation increases as distance increases.  But soil moisture, alone, does not account for the low diversity found from 25-50 m.  Fortunately, I’ve also collected data regarding shrub cover (that I suspect limits forb species).  I also have elevation data from each quadrat and am thinking about using it to calculate the steepness of slope gradient.  As I was sampling my transects, I noticed that both of these factors seemed to relate to quadrats in which no forb species were found.

Regardless, I still have some statistical analyses to perform in order to know which results are significant.

Blog Post 2: Sources of Scientific Information.

User:  | Open Learning Faculty Member: 


The paper that I chose is- The protective effectiveness of control interventions for malaria prevention: a systematic review of the literature. The paper is written by experts in the field associated with Malaria Research Unit, Institut Pasteur de Madagascar and  Institute for Biomedical Research of the French Armed Forces (IRBA), there are in-text citations and the paper also contains a bibliography. It is academic material that has been peer reviewed. The paper has methods and results so it is considered as a research article.

I found this article on F1000Research.com, so using the tutorial: How to Evaluate sources of Scientific Information I can say that this paper is an academic, peer reviewed research material.

Thomas KestemanMilijaona Randrianarivelojosia, Christophe Rogier(2017).The protective effectiveness of control interventions for malaria prevention: a systematic review of the literature.https://f1000research.com/articles/6-1932.

Blog Post 1: Observations.

User:  | Open Learning Faculty Member: 


The area that I have selected to observe is the University of Manitoba South Wood lands, which was a former 120 acre  golf course next to the Red river. I was at the area on Sept 17th, Thursday from 4:10 pm to 5:00 pm. The temperature was 13°C which is the average fall temperature in Winnipeg around this time of year. It was quite sunny and not very windy. The vegetation is mostly grasslands, with tall and short grasses, pine trees along with the other local tree species which could be cottonwood and Elm wood long the riverbanks. There are two ponds on the golf course which are hot spots for the geese in the location, Winnipeg has urban geese which are present throughout the spring, summer and fall. The migratory geese (Branta canadensis and Branta hutchinsii) arrive in the fall around this time which  is why there are so many geese present in the grassland and around the ponds. Along with the geese there were so many white tailed deer feeding on the grass and weeds-dandelions.


Image 1: Map of the South Wood lands.  

Image 2 & 3: Journal pages.


There were a lot of birds chirping, I heard at least 4 different kinds of birds. One kind were shrikes based on the appearance and sparrows and jays based on the appearance as well. There  were trails along the river, few people were taking a walk. There were dragonflies and burrows in the ground around the ponds, showing that there might be rabbits and moles in the grassland. There was a lot of cricket noises along the river and there were few geese swimming on the river as well. More than 5 squirrels were spotted, there were a lot of pine nuts on the floor near the pine trees which the squirrels seemed to be collecting.

Image 4 & 5: open grass land and trails.


Based on my observations the three questions I asked are:

  1. How has the geese population affected the role of the other wildlife in this grassland area?
  2. How does the human activity around the south wood lands affect the deer and geese activity in the open grassland and riverbank area?
  3. How much resources are available for the urban geese when the migratory geese arrive in the fall? And also how the weather plays a role in how much deer activity is noted?

  Image 6: Deer feeding on the vegetation.

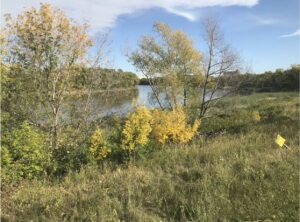
Image 7: The Red River.

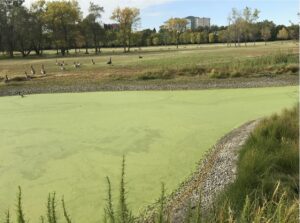
Image 8: Geese around pond 1.

Blog Post 5 – Design Reflections

User:  | Open Learning Faculty Member: 


     So far I have not had much difficulty in actually implementing my sampling strategy, but I did have some questions to answer before initiating my strategy. Firstly, I had to consider that although I am observing honeybee activity in relation to the road, I had to find plants in each location that would be similar enough to sample the activity of the honeybees. I have chosen 3 plants that all contain flowers and leaves and seem to have honeybee activity regularly.

     After doing my replications, I was somewhat surprised with the results! At a quick glance, the elderflower shrub has an extensive amount of insect activity. But after observing the plant for 5 minute increments, I noticed that majority of these insects were not the Western Honeybee. Regardless of this, I was able to obtain some number for each replicate to add to my study.

     I think I will continue to collect data using the same technique as it makes the most sense for my study. I will keep the same plants I initially observed as I think they are the most similar and will assist in the accuracy of my study. Not only are these plants similar in looks, but they are also all cultivated plants which will help to keep my samples similar as opposed to having some cultivated plants and some naturally occurring plants.


Below is my replicate chart and the plants I intend on using for my study:


Replicate Number

Time of Point Count

Number of Western Honeybee Visits

1st

1259hr

17

2nd

1304hr

11

3rd

1309hr

9

4th

1314hr

14

5th

1319hr

15