Recent Posts

Blog Post 3: Ongoing Field Observations

User:  | Open Learning Faculty Member: 
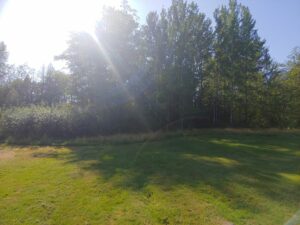

The organism that I plan to study is the Trembling Aspen Populus tremuloides , found in a pure stand on the west side of my study area. The Aspen tree is found throughout the province of BC and grows best in moist, well-drained soils. It produces root suckers that grow into clones that become a colony over time(British Columbia, n.d.). The Trembling Aspen prefers to grow in full sun as it is intolerant of shade.

My study area is an open field in a Regional Park that is surrounded by forest. These Aspen trees are comprised of a pure stand that is of mixed age and are located in a small area approximately 150m by 200m in size. There are a variety of different diameter sizes and height differences in the stand of trees, the larger of them are further west, deeper into the forested area, whereas the smaller trees are found closer to the open field. The soil was compact throughout the stand but was drier at the north end and moist at the south end. It appeared that there was a higher density of smaller diameter trees at the south end, closest to the open field.

Since the Trembling Aspen is shade intolerant, the new suckers and clones will likely survive best if they grow in the full sun, closer to the open field then under the dense forest canopy. Also, since the soil appeared to be more moisture on the south end, perhaps this is also a limiting factor to new tree growth.  I predict that within the Trembling Aspen stand there will be a gradient,  a higher abundance of younger trees (smaller trunk diameter) closer to the field and south and lower  (larger diameter) as I move inward to the forest and north.

The response variable is the size / age of the Aspen trees (diameter of trunk) and the explanatory variable would be the availability of sunlight and soil moisture. Both the response and explanatory variables would be continuous.

Blog Post 9: Field Research Reflections

User:  | Open Learning Faculty Member: 


My field project took a while to jump start, I had to change my subject of interest and location due to the unforeseeable weather changes in the prairies. First we had flooding (dikes were built and flood evacuations were issued), and any area near the river was closed off for almost two months. Followed by crazy wind storms, and tornado’s touching down – so again a new location was needed to carry out my research. So in summary, I had many changes to the design before actually implementing the final one.

Once if was formed, and after data collection was finished no other issues came up – which is really nice.

Engaging in the practice has altered my appreciation for how ecological theory is developed. I think that ecology observation studies require a lot of patience, time, and the ability to adapt with changing conditions – as nature is constantly changing.

This was a wonderful course, and I really enjoyed stepping out of my usual biological study stream. Ecology was refreshing and the topics very fascinating and applicable to everyday life.

Blog Post 9

User:  | Open Learning Faculty Member: 


I changed my hypothesis to make my project more community ecology focused. I changed it to:

the spatial distribution of garter snakes (Thamnophis sirtalis) is determined by body size and ambient temperature.

I also had to change many parts of my project but I was able to keep and use the data I had collected over the summer. I also changed my study design to a logistic regression design. Over the course I now understand more ecology theory and practices. Ive also learned how vast the field of ecology is.

Blop Post 7: Theoretical Perspective

User:  | Open Learning Faculty Member: 


Seasonality, weather, and type of topographical vegetation are contributing factors to white-tailed deer activity and movement. However, the prairie ecosystem of North America is vast in area, so activity and movement  varies within regions. To effectively manage and track white-tailed deer populations, region-specific empirical information such as which kind of vegetation coverage has higher white-tailed deer activity during a specific season needs to be collected.

Keywords:  white-tail deer, vegetation coverage, activity

Blog Post 6 Data Collection

User:  | Open Learning Faculty Member: 


I collected my field data on 2 separate days (March 4, 2020, and August 6, 2020). The second survey day was to address my initial field survey design flaws. I needed to replace my dropped eastern auxiliary plot (as the original had been in Lost Lake) and to collect 5 more replicates. I increased the number of replicates, as 10 is the oft-repeated rule of thumb for a variable of interest.

As I now have 10 replicates, and 4 trees surveyed at each replicate, I have 40 trees sampled. I used the Vegetation Resources Inventory (VRI) Ground Sampling Procedures methodology to replace my dropped auxiliary plot. I also used these methods for 5 additional replicates, totalling 10.

August 6th was overcast, 20 degrees Celsius and called for rain. It had rained in the morning and I had hoped to collect data within the opening that rained ceased in the afternoon. I was unlucky and I had also not made my data sheets on water-proof paper. It was really difficult and an oversight I would never do again.

In my hypothesis, I stated that I would find conks on only one tree species and that is currently not being supported by my data. I have found conks on deciduous and coniferous trees. What is being supported is that conks appear on trees that have some type of decline present.

Blog post five – Design Reflections

User:  | Open Learning Faculty Member: 


The data collection process was not only interesting but also challenging. The existence of numerous tree species both of which are springing and the grown ones made the process rather challenging. Getting to the field or the area of study was not as hard. However, studying the different species of trees and classifying them to ensure a seamless data collection process was rather hectic than earlier presumed. During the data collection, some trees were cut down and there were new species that had been planted with the area. These two variations brought some challenges in the sampling and data collection processes. Apart from these small hiccups, the data collection was effective and the sampling method worked well as postulated during the sampling strategies. The sampling method was not rigid but rather flexible hence allowing for in house variations such as including the new species that had been planted. Movement of people within the region and the changes in the climate could affect the species of the plans making them become more endangered or even causing deforestation to obtain more space for both residential and office purposes. The sampling process is effective hence I would still use the same structure for more research and data collection on the case study.

Post 9: Field Research Reflections

User:  | Open Learning Faculty Member: 


My study design remained quite consistent throughout the course of the research project. My understanding of experimental design, however, did develop substantially. Early on I decided that i would divide my sample plots into elevation zones that correlated with the environmental gradient, which I hypothesised would respond to elevation from the lake shore. In doing so, I realised the purpose and importance of subplots in field experiments, as they allowed me to accurately analyse data from the seperate sample plots — by comparing data sampled from the same elevation zones in the different plots. As my hypothesis developed I also became aware of the influence of substrate on my response variable (species composition), which would make it difficult to determine the extent to which my predictor variable (elevation/flood frequency) affected it. However, as my research progressed I realised that that substrate is also very much influenced by flood frequency, and thus is closely tied to my predictor variable. For this reason I included substrate descriptions in my sampling, and took it into consideration in my analysis of the results.


Blog Post 8: Tables & Graphs

User:  | Open Learning Faculty Member: 


I had some issues with aggregating my data as this is my first time working with scat as a response variable. First, I had to figure out how to quantify the average of all replicates collected for the response variable. I decided to divide the total number scat (one scat being defined as one pile of white-tail deer droppings) for each terrain type by the total number of replicates (i.e. quadrats). Thereby, I was calculating the average scat amount per quadrat (1m2) for each terrain.

The outcome was as I expected, with a higher average of scat per 1m2 for the open-grass area. However, the difference between the two areas was not as large as I first predicted. I need to conduct statistical analysis to determine if the difference was significant.

Blog Post 2

User:  | Open Learning Faculty Member: 


a.) Source Used: Online article by the World Wildlife Fund (WWF) which states that wildfires could be worse in 2020 than in 2019, globally. Link : https://wwf.panda.org/es/?659911/incendios2020

b.) Classification: non-academic material

c.) How do I know this?

In order to classify this source of ecological information I first had to decide if this source was academic material or non-academic material by answering 3 questions:

1. Is this written by an expert in the field? Although this article is from the WWF website there was no mention of an author and therefore it is not possible to identify if the writer of this article was in fact an expert in the field. Because of this, I labelled this article as not written by an expert in the field.

2. Includes in-text citations? This text gives credit to multiple quotes in the article and gives links to 2 other articles throughout the paragraphs, one of which allows you access to the full report “Forest Fires and the Future: A Crisis Out of Control?”

3. Contains a bibliography? This article does not contain a bibliography

Even though one of the answers to these 3 questions was “yes”, it is not enough to confirm that this piece is in fact academic material, and for this reason I chose to label this article as non-academic material.

If was was to further discriminate among different sources I would then look into this piece and observe if it has been peer reviewed or not by at least 1 referee before publication, which I could find no evidence of. I could further confirm my labelling of the source by finally deciphering if this piece is research material or review material, and since it is not even academic material nor is it peer reviewed, this question need not apply.

Blog Post 6: Data Collection

User:  | Open Learning Faculty Member: 


I collected my field data August 23, 2020. I collected 12 replicates for the dense forest area and 12 replicates for the open grass area. The only problem I have faced in implementing my sampling design is that in the past week it has been very windy and on August 17th two small tornado’s touched ground 20 minutes away from the zone of observation.

I have no problems implementing sampling design.

I have noticed an ancillary pattern that has caused me reflect positively on my hypothesis. I have noticed that deer activity has decreased the past week due to the wind storms, so less scat is found in both areas. However, the original pattern that more scat is present in open grass area is still present.