Recent Posts

Blog post four – Sampling Strategies

User:  | Open Learning Faculty Member: 


The sampling process for the trees was built on the analogy that the three main tree genus chosen were native the region. Sampling would ensure a clear understanding, observation and data collection of the different types of trees within the area. Sampling in this case is not limited to the individual trees but also their surroundings and the relationship they have with their immediate surrounding. There are different sampling techniques that can be employed in this case study. The probable sampling techniques to be used include simple random sampling (where the sample plots are placed randomly within the ecological gradient using random allocations the locations could not be similar in terms of the tree representations but they would have some samples within the environment), systematic sampling (a fixed selection is employed hence ensuring that the plots have a regular arrangement or rather pattern from which the case study can be carried out. The areas are carefully selected in such a way that all the samples are included within them), Cluster sampling (where the plants are grouped in clusters either systematically or stratified the subgroups or clusters are the ones used as the sampling units rather than the individuals within the population) and stratified sampling (where the population is divided into smaller groups or subgroups known as strata where each strata consists of a single population or rather according to the species). Stratified sampling is the best sampling method for this case study. It would ensure for classifying or rather sampling according to the different species. The sampling method is very advantageous for this study since it increases the precision and accuracy of the study hence reducing the errors and bias that could be made during the study. It also allows for the employment of other sampling procedures making the study dynamic hence producing better results and effective data collection.


Blog post three – Ongoing Field Observations

User:  | Open Learning Faculty Member: 


The study explores the different types of trees in the different environmental ecosystems. The trees are distributed everywhere both in private and public land. There is a difference in their heights their physical appearances and even the smell or aroma which they emit. Some of the trees have bloomed and their different flowers have attracted various birds and even insects including butterflies and bees. From the different presentations and distributions, it is evident that there is an extent of variation in the types of trees across the ecological gradient. The difference lies in the species varieties, their color, heights, flowering and fruiting seasons, and the distribution both in the private and public areas. There are more than 100 species of trees within the region. A majority of them fall in the genus Eucalyptus. In as much as initially, oaks were the predominant species, the genus Eucalyptus is rather a majority within the region. The other types of trees include oaks, cones or rather cedars, Magnolia, Pine, cypress, palms amongst others. The tallest tree which is also the oldest is an Old Coast Redwood from which the town was named after. However, the redwood are very few as compared to the presumption that they would be numerous within the environmental gradient. The different types of eucalyptus have different features and also florals which bring forth the beauty of the area. The pines and other canopy trees create canopies that provides shade for humans. Eucalyptus trees consists of approximately 60 species (including E. acaciiformis,E. caesia, E. laeliae, E. maculosa amongst others) pine trees have about 30 different species(including P. eldarica, P. jeffreyi, P. mugo, P. sabiniana P.nigra amongst others) whilst the cypress consists of 7 different species which include Cupressus (C) arizonica, C. macrocarpa, C.torulosa, C. funebris amongst others. One of the hypothesis to be tested was whether human encroachment and population growth within the area affects the different types of trees within the area.

Blog post 1 – Observations

User:  | Open Learning Faculty Member: 


The study site for the study was within a 3-km radius at the Stanford University near Palo Alto California. As indicated, the site selected represents the urban-semi-urban environment which would be ideal for the study. The sites for the study included a biological preserve, the open space recreational area, the golf course, the residential area, the office park as well as the business district. The area of choice is a mixture of both urban and semi-urban making it an urban-semi-urban area making it highly appropriate for the study. The interaction of people, animals amongst other living and non-living organisms with the environment is interesting hence making the area ideal for the research.  The area is fascinating due to the landscape (hills, valleys and wetlands) and the different organisms therein. The topography allows for the different organisms to thrive and coexist hence creating a unique ecosystem within the region. The different topography could have different species and diverse interactions of the organisms that exist therein.

These differences would enable dynamic research in terms of the different organisms and ecosystems within the area. A diversity that exists seamlessly within the ecosystem. There are several potential case studies that would include the different types of birds, crops, plantations, wetlands, and insects especially butterflies and bees. The area is covered by various trees that are each different but bring forth an aesthetic view and surroundings. The potential subjects I would want to study different crops from the different areas of study.

The study will help answer different questions which include; what is the difference in the tree species and varieties in different locations? How is human encroachment and settling affecting the different species and diversities of the trees within the area? Is acidic rain and other climate change variants affecting the growth and development of trees within the different locations and environments? Some of the questions to also be asked include: what are the different characteristics of birds in the different areas of study? Does the environment change have an effect on the population of birds in the different topographical locations?


Blog post 2 – Sources of Scientific Information

User:  | Open Learning Faculty Member: 


The sources of information for the study would include botanical books that are in the library. The information documented therein would help understand the evolution of the vegetation especially trees within the Palo Alto area. There are various books within the library that not only show the history of the Palo Alto vegetation. They are unchangeable and were written by people who inhabited or visited the area at different times in history. Understanding the history of the trees from the perspective of other botanists would come in handy in ensuring the data collection and analysis are done effectively rather than using guesswork. The books also provides education and lessons on the different species hence making it easier to correlate the different types of trees within the ecosystem. Additionally, peer reviewed articles would be a great source of information that would connect the past to the present hence help project the future and becoming a guide for the study. The articles contains information that peers within the ecological field have found or rather discovered over time. Most of these articles have been verified to be useful especially those that have been published in google scholar amongst other scholarly sites. Therefore, becoming a basis for understanding and developing the hypothesis and the thesis.  Published articles within the university’s environmental magazines and journals would also come in handy. These articles not only contains the various tree genus but also informs of the possible changes that occur in the tree plantations and distributions not only within the campus but also outside.

Another source of information for the study was a scientific research article and the types of information presented is academic peer-reviewed review material. This is because the information is published by the Ecological Society of America and made available on JSTOR, a digital library which was founded in 1995, in the United States (“Terms and Conditions of Use | About JSTOR,” n.d.).

Reference

Terms and Conditions of Use | About JSTOR. (n.d.). Retrieved September 1, 2020, from https://about.jstor.org/terms/

Blog post #4: Sampling Strategies

User:  | Open Learning Faculty Member: 


The three techniques I used were: systematic area, random area and haphazard.

The fastest method was systematic area with a total time of 12 hours, 37 minutes. Second fastest was Haphazard with a total time of 12 hours, 56 minutes. The longest sampling time was random area with a total sampling time of 13 hours, 14 minutes.

The calculated percent error for the most common species:

Eastern Hemlock

systematic area: 1.25%

random area: 22.58%

haphazard: 2.14%

Sweet Birch

systematic area: 8.94%

random area: 94.04%

haphazard: 21.7%

The calculated percent error for the least common species:

White Pine

systematic area: 4.76%

random area: 42.86%

haphazard: 52.38%

Striped Maple

systematic area: 100.00%

random area: 128.57%

haphazard: 14.28%

The accuracy was better with the higher density species. As the density lowers, a much higher error occurs. Using a systematic area method had the best chance of a low error with errors generally below 10% except where the species was not detected at all. Haphazard also produced lower errors while the random area method produced errors of at least 22.58% ranging up to 128.57%.

Blog Post 7: Theoretical Perspectives

User:  | Open Learning Faculty Member: 


The purpose of my research project was to investigate soil moisture as a potential limiting factor of tree size and frequency in my study area. In measuring soil moisture along a slope, an ecological process that my hypothesis and research touches on is the hydrological cycle. It focuses on water infiltration of near-surface soil, percolation and, indirectly, water uptake by surrounding vegetation and trees (Freedman et al. 2015). Ideas underpinning my research project include how gravity impacts water distribution in near-surface soil layers along a slope, how varying degrees of soil moisture impact surrounding vegetation, specifically trees in my research, and conversely, how vegetation impacts soil moisture.

Keywords: Soil moisture, slope, balsam poplar forest

References

Freedman, B., Hutchings, J., Gwynne, D., Smol, J., Suffling, R., Turkington, R., Walker, R. and Bazely, D. 2015. Ecology: a Canadian context. Second edition. Nelson Education, Toronto, Ontario, Canada.

Blog Post 1: Observations

User:  | Open Learning Faculty Member: 


I have chosen a much larger area for my research project; The Bow Valley Area in Alberta, Canada. The area of focus will be, Peter Lougheed Provincial Park.  The area of study will encompass 304 square kilometres; totaling all three provincial parks .  As covid has encouraged more people to get outside and utilize our wild areas, this has caused an influx in human activity in and around our provincial parks.

I first visited the sites to gain initial observations on  August 20th, 2020 at 08:30hrs. The weather was favorable, 10° with winds  averaging 8km /hr to the sw with no precipitation.

The park is home to an abundance of terrestrial wildlife and rich in native flora and hosts an abundance of Buffaloberry (Sheperdia canadensis)  which is a major food source for the Alberta grizzly bear (Ursus arctos ) population as they enter a state of  hyperphagia. The geography of the study area consist of rolling hills and mountains, with (2) rivers flowing though it, Kananaskis and the Bow River. There are recreational day use areas that surround large water bodies; numerous lakes are found in the park boundary. (Figure 1)
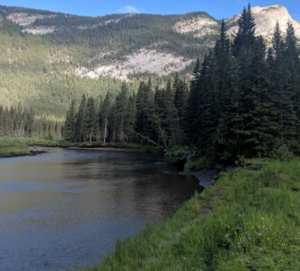
.  (Figure 1.)  Peter Lougheed Provincial Park

Listed as a threatened species under Alberta Wildlife Act, this time of year is crucial for foraging for food consumption for the bears.

Of all sites visited within the study area, it was observed that buffaloberry is abundant as a natural attractant alongside active hiking trails and roads withing the study area.  August is a prime time for foraging as the berries are ripe and in abundance.


The general observations in all the park was :

  • An abundance of buffaloberry bushes (Figure 2)
  • At least (1) bear was observed foraging within 5km of a Day Use Area (Figure 3)
  • Most Day Use Areas and trails were packed with people who recreated ,in particular groups of 3 or more people

The questions I asked and sought answers to are:

  1. During foraging season, does the increase of human activity in the park have a direct correlation with how the bears feed?
  2. Does this increase negative human/ bear  interactions?
  3. Does this deter sows with cubs from accessing abundant food sources near road ways and popular Day Use Areas and trails?

Buffaloberry
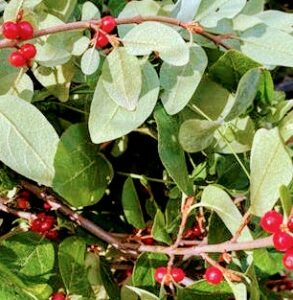
(Figure 1) Buffaloberry , 2020


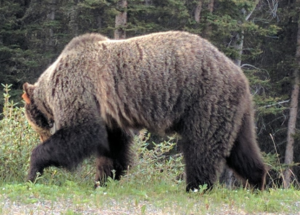
(Figure 3) Grizzly Bear 159 feeding on buffaloberry in Peter Lougheed Provincial Park, 2020


Evidently, should the data show negative responses to the questions above it can be assumed that this will play a role in the success of hibernation for the bears as well, they can develop a high tolerance to human presence. This may impact, negatively the success of the population if the female does not attain sufficient body fat or weight during the summer and fall as the embryos will not attach to the uterine wall. Ultimately I will focus on the negative human/bear encounters to determine if the more people that access the park causes an increase in these types of encounters during foraging season.

Blog Post 6: Data Collection

User:  | Open Learning Faculty Member: 


I completed my data collection over two days (August 3rd, 2020 and August 4th, 2020), totalling approximately 11hrs10mins. Forecasts were similar throughout both days, averaging around 23°C with moderate to high degrees of sunshine. In the week leading up to my data collection there was only approximately 1.5mm of precipitation. I subdivided my chosen area into three subareas, and implemented systematic sampling. Across each subarea I collected data from 10 quadrats (2.4m x 2.4m), with 5 distinct soil moisture readings and percent slopes within each quadrat, as well as a tally of the number and types of trees present and their respective DBH measurements. I didn’t encounter any major problems throughout the data collection process, however navigating the terrain in some sections was challenging as was identifying certain trees.

Initial inspection of the data suggests that soil moisture, on average, was lowest at the bottom of the hill at mild percent slopes, mid-range at the top of the hill at high percent slopes and finally, highest at the midpoint of the hill at moderate percent slopes. These findings are contrary to my hypothesis but are partially representative of the results from the preliminary sampling exercise. In both cases, soil moisture was highest at moderate degrees of slope. In terms of tree size, the trees were, on average, largest at the bottom of the hill, and decreased in size as percent slope increased moving up the slope. Tree frequency showed a similar pattern, with frequency being, on average, highest at the bottom of the hill, with decreasing numbers as percent slope increased moving up the slope. These findings are also inconsistent with my hypothesis since I hypothesized that tree frequency and size would be inversely correlated.

Blog Post 7: Theoretical Perspectives

User:  | Open Learning Faculty Member: 


My hypothesis (that the community structure of forb species changes as elevation increases within a riparian environment) is likely related to several underlying processes within my study area (located on the Eastern bank of the South Saskatchewan River in Saskatoon). The underlying processes that (appear to) impact the types of forbs and their abundance along the elevation gradient are soil moisture/type, cover, competition, and disturbance.


I have soil-sampled (through hand texturing) each of my quadrats and it seems that the soil moisture content is related to the types of forbs that I find at various elevations. I initially expected to see a steady decline in soil moisture as elevation increased; however, soil moisture was not directly related to elevation in all locations. Areas with dense shrub cover appear to have higher soil moisture than areas without cover at similar elevations. In addition, the quadrats shaded by heavy shrub cover do not appear to have the same community structure as quadrats with similar soil moisture and are not shaded. Therefore, this has led me to believe that competition from shrubs and canopy cover may also influence the community structure of forbs in the area.


Finally, it is notable that some transects have an elevation difference of 25 meters (from the lowest quadrat to the highest quadrat). The study area maintains a (relatively) consistent river depth throughout the year because of its close proximity of a weir (which was constructed for the purpose of maintaining a consistent water level within the city). Therefore, flood disturbance does not likely play a major part in community structure at higher elevations. However, the modest fluctuations in river depth do submerge the lowest quadrats when the river is high. Therefore, flooding may also be an influence on forb community structure within my study location.


On a broader, theoretical level: different species of forb within my study area are likely to have a wide variety of adaptations to deal with disturbance, water submergence, drought, and shade. While these adaptations remain unknown to me at the moment, I can speculate on several adaptations that some of the forb species may have. For example: it is possible that drought tolerant species (found closer to the uplands) have deeper roots (that can penetrate lower in the soil to access groundwater) than the forb species that exhibit a preference for areas with higher levels of water saturation. Conversely, species that exhibit a high preference for low elevations may have adaptations to prevent them from becoming waterlogged by high levels of water saturation.


Keywords: Riparian vegetation, forb community structure, elevation gradient